European Parliament Elections - May 2024

Article byIDEA Consulting Research TeamPublished on Sun May 26 202416 minute read
Executive Summary
Two weeks before the European Parliament elections in June 2024, Malta Survey conducted research through its online polling mechanism to identify the Maltese public’s sentiment and voting intentions during May 2024. The sample was collected between the 14th and 20th of May and consists of 1,639 participants putting the margin of error at 2.5%. The survey shows that:
- The gap between the Labour Party and the Nationalist Party is 9.7%. This confirms a narrowing of the gap from 13.4% as per our April 2024 online poll.
- Due to the inheritance system, we may be heading into a result where both major parties will share an equal number of representatives in the European Parliament.
- Roberta Metsola for the PN and Alex Agius Saliba for the PL are the leading candidates from the selection.
- Prime Minister Robert Abela has an absolute majority in the trust in leaders at 41.7%, followed by opposition leader Bernard Grech at 27.2%. This gap has also narrowed since our April poll. ADPD leader Sandra Gauci enjoys 4.9% popularity. 26.2% of the sample stated that they do not have trust in any of the current leaders.
Survey Methodology
This online survey was carried out between the 14th and the 20th of May 2024. The survey was hosted on Malta Survey’s website - www.maltasurvey.com. Notice of its release was given through digital advertisements on social media platforms. No direct targeting or use of any pre-known datasets was done, thus protecting any identification of the sample’s participants. Each submission was verified through a series of automated checks and guards to prevent duplicate responses and ensure the legitimacy of the data. Participants had the option to carry out the survey either in Maltese or English and effort was made to ensure that all questions were neutral and non-leading. All submissions were gathered through Malta Survey’s platform and the anonymity of the sample base was ensured. Analysis was done using data science tools.
Sampling and weighting
Sampling was carried out using stratified methods to mirror the demographic composition of Malta’s electorate, including age, gender, region and education. Following sampling completion, statistical post-stratification weighting was applied to adjust for any discrepancies between the sample and the general population, ensuring that the results accurately reflect the views of the electorate as closely as possible.
Data Security & Privacy
Malta Survey adhered to strict protocols to protect the confidentiality and integrity of survey responses. All data transmissions are encrypted and no personal information is stored in the survey’s dataset.
Limitations & Disclaimer
Whilst Malta Survey’s digital polling methodology is designed to minimise errors and biases, it is important to acknowledge potential limitations. The reliance on digital technology means that any individual without internet access may be potentially underrepresented. Despite efforts to ensure a representative sample, the self-selecting and fully voluntary nature of the respondents could introduce some level of response bias. However, like all survey methods, it is subject to certain inherent limitations that are diligently mitigated through the design and execution of the polling process.
Margin of Error
As of April 11, 2022, Malta’s population of people aged 16 years and over stood at 447,456. With a sample size of 1,639, the findings mentioned below have a margin of error of 2.47% at a 95% confidence level. Specific sub-divisions by demographics and/or specific cohorts will have larger margins of error due to the smaller size of the sample portion considered.
Findings
Demographic Analysis of the Sample
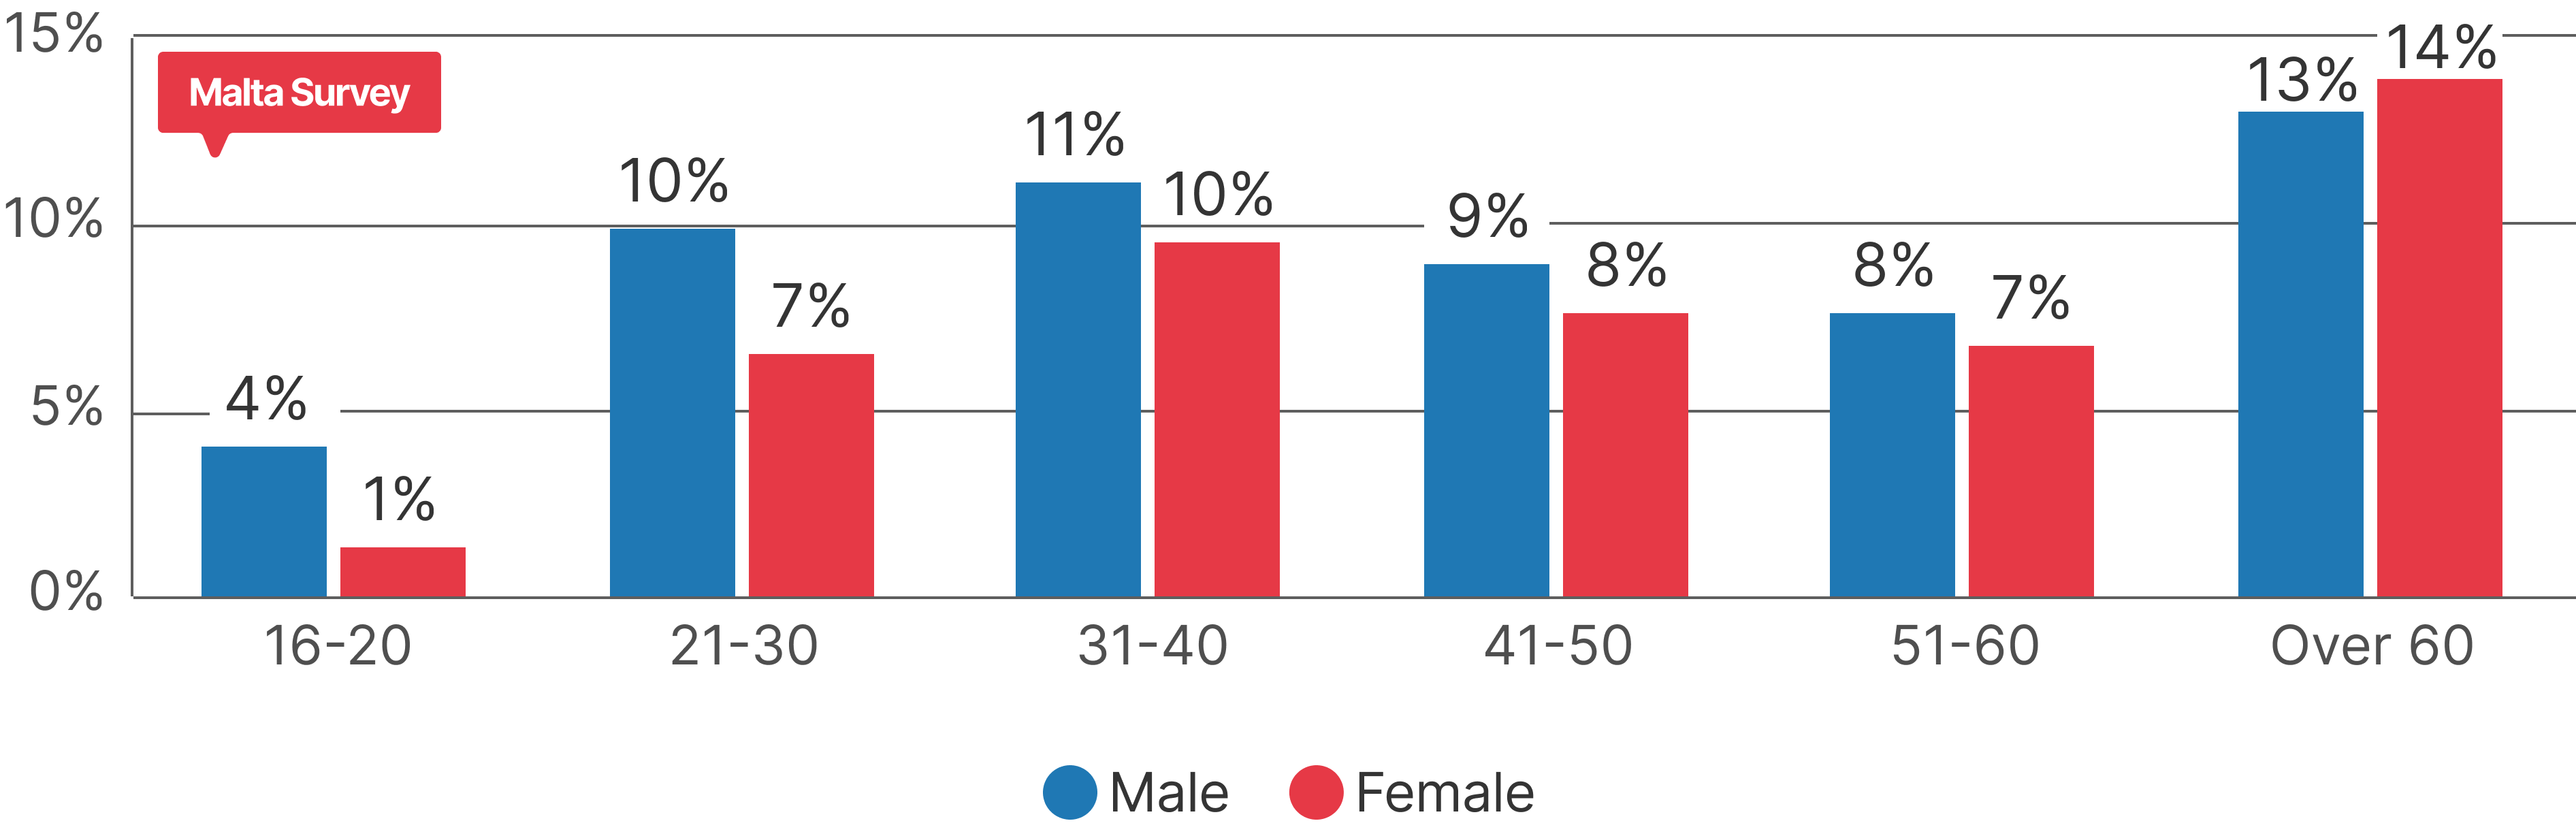
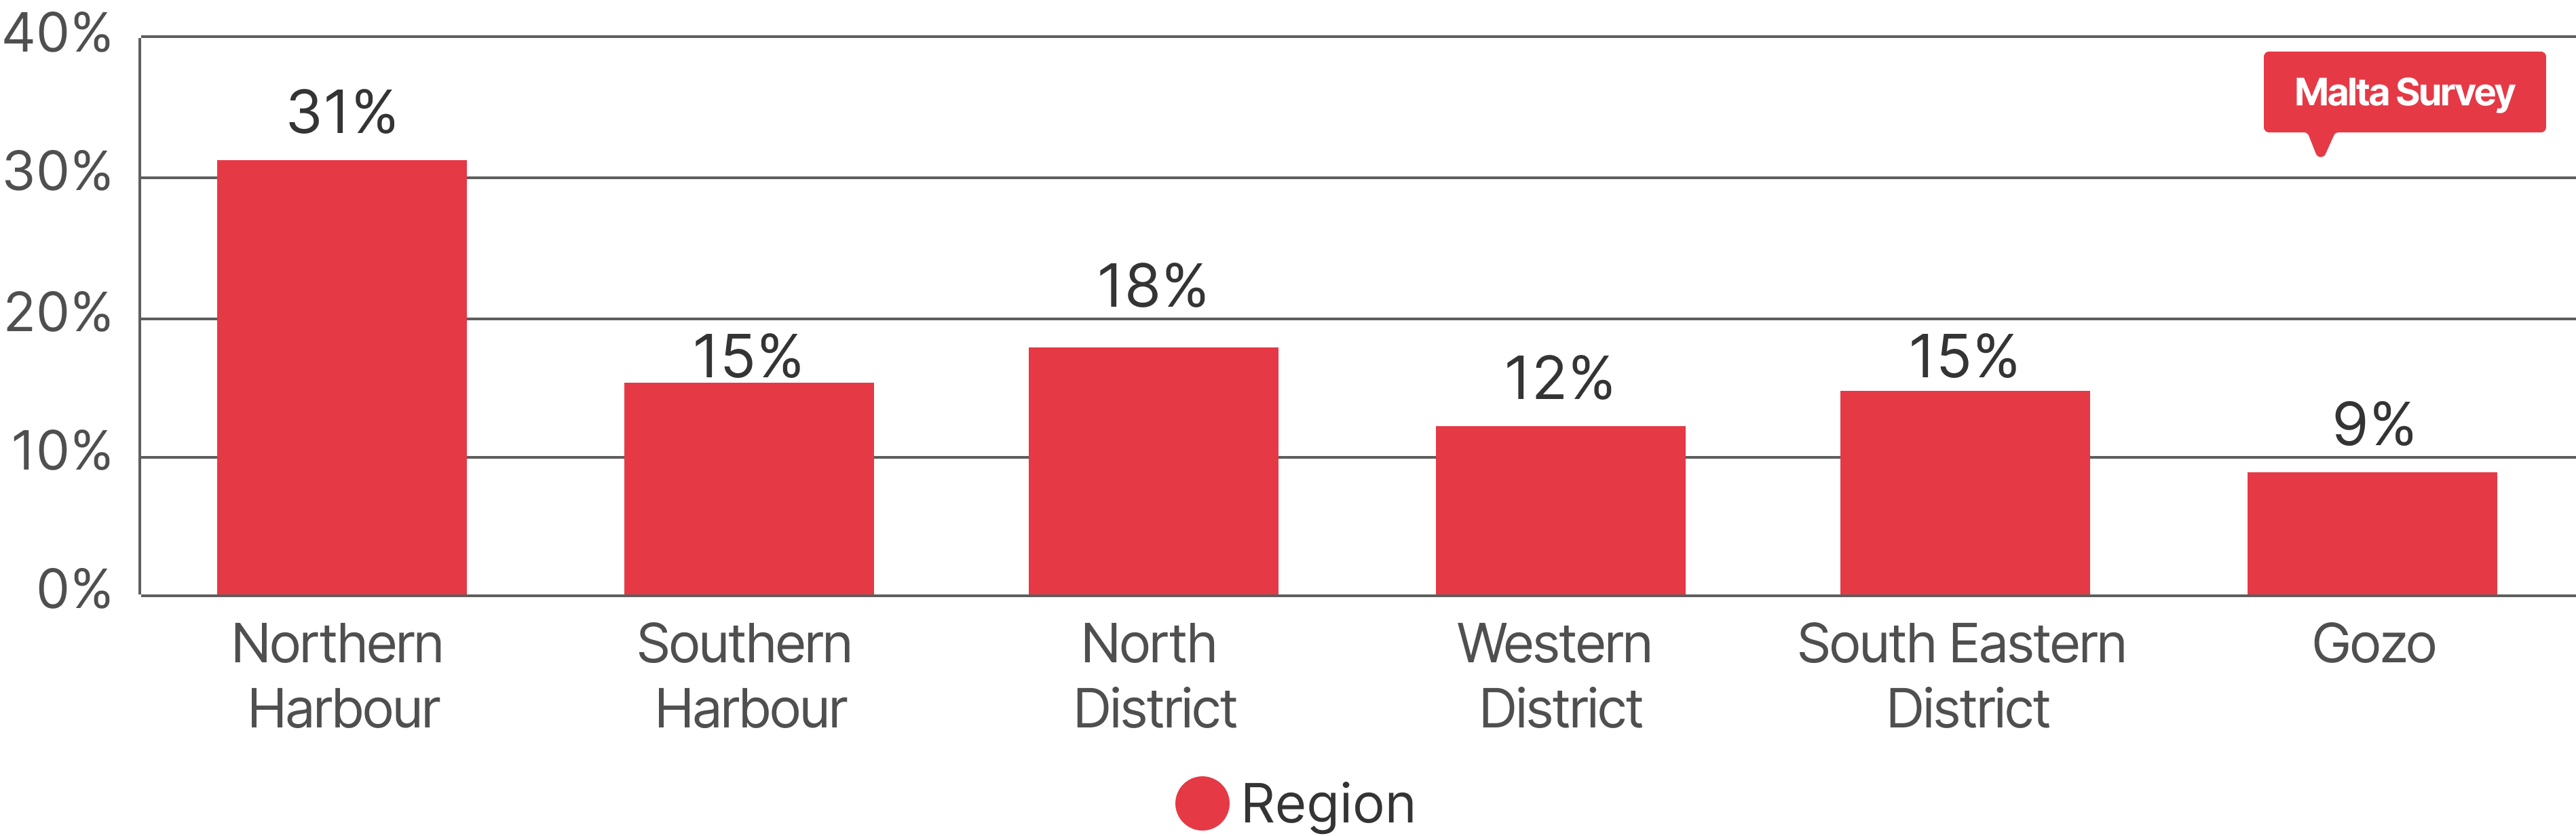
The sample includes 1,639 participants, with 54.5% males and 45.5% females, distributed across different age groups. The regional distribution indicates that the sample is representative of the population of the Maltese islands.
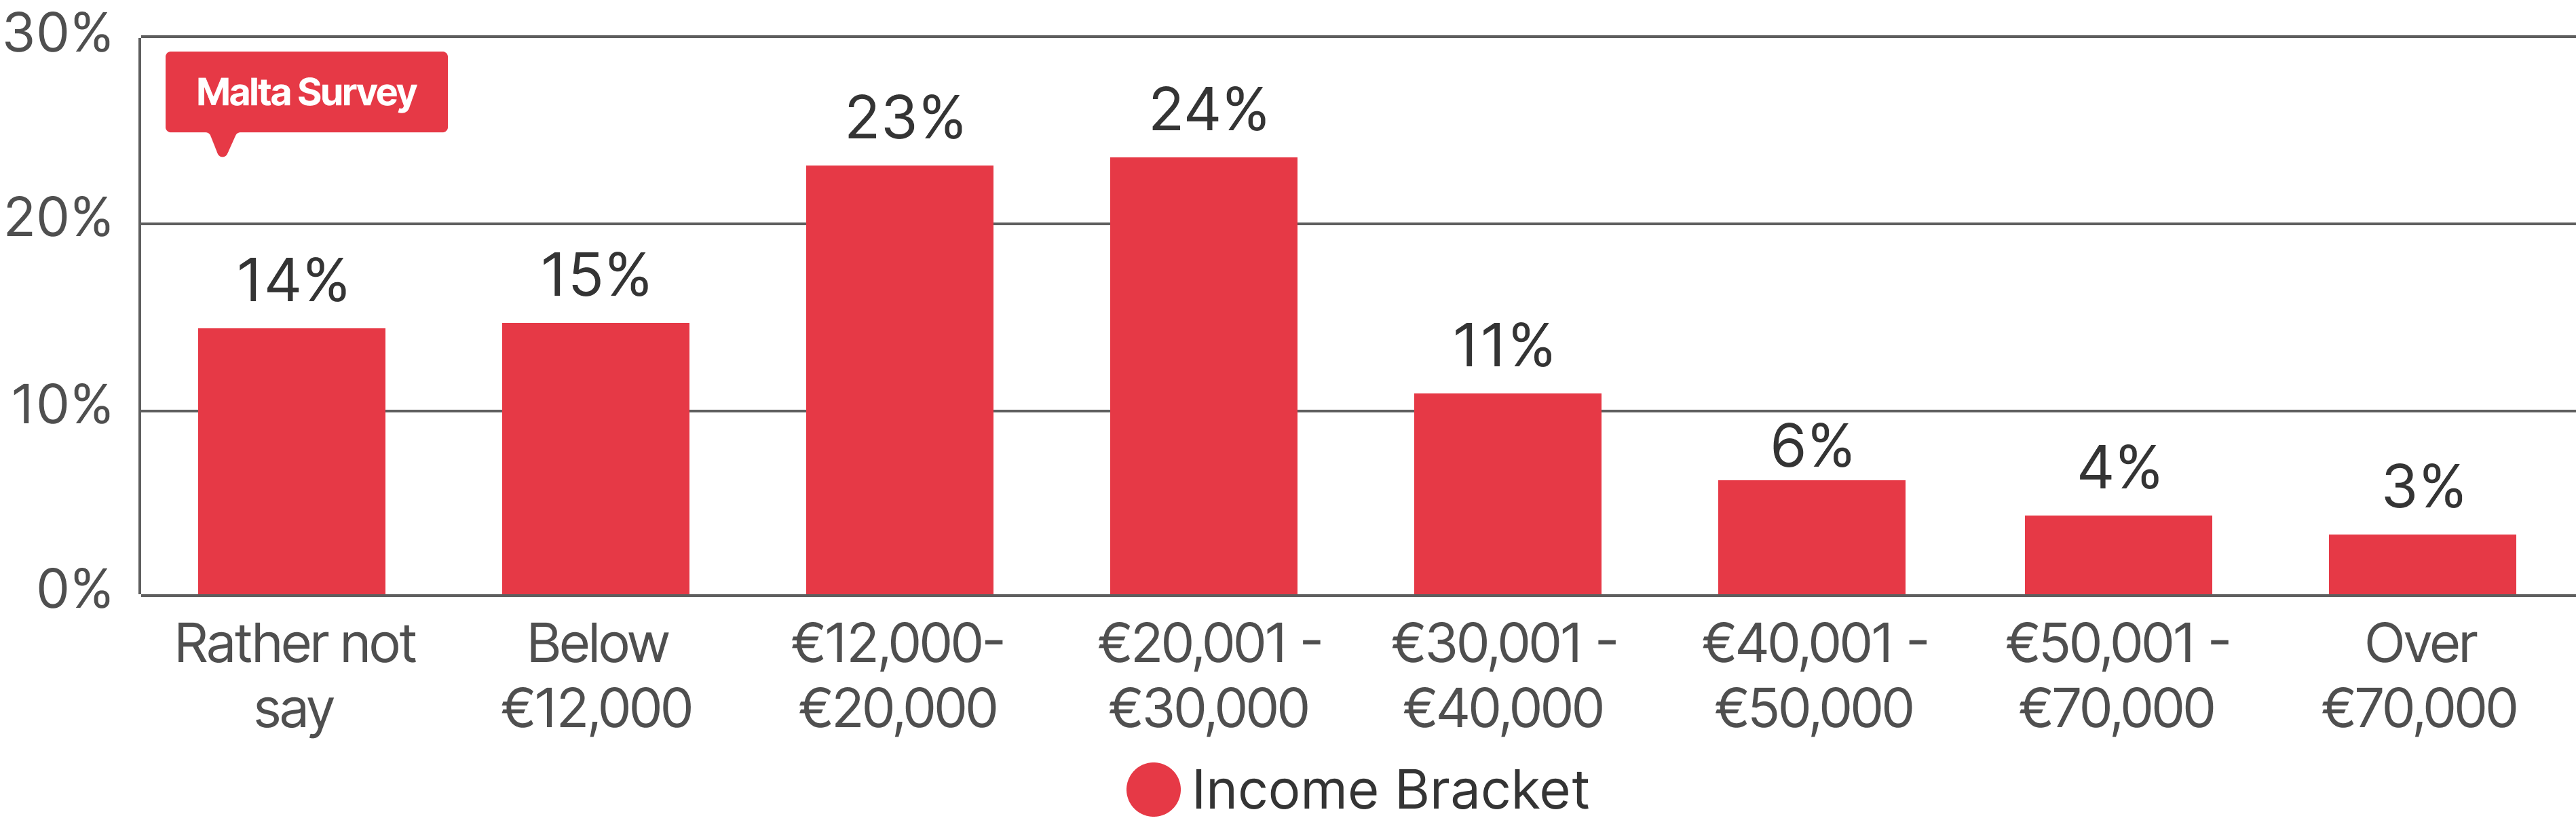
The income distribution of this sample peaks within a range of €12,000 to €30,000 annual income. It's noteworthy that slightly less than 15% of participants chose not to disclose their income bracket, indicating a possible unverified shift in income distribution.
The online survey had the following research questions:
- What are the voting intentions of the upcoming European Parliament Election on June 8th 2024?
- What is the trust amongst the major party leaders?
- What is the public’s perception of the EU’s importance to the nation?
- What is the public’s perception of the performance of the Government and the Opposition?
Our sample's voting intentions
The initial observation is the notably high perceived turnout of this sample compared to other surveys periodically conducted in Malta. The nature of online surveys tends to attract individuals who are more likely to vote than those participating in other survey methods. Research indicates that online surveys, being voluntary and opt-in, generally garner greater interest from individuals who are likely to participate in elections.
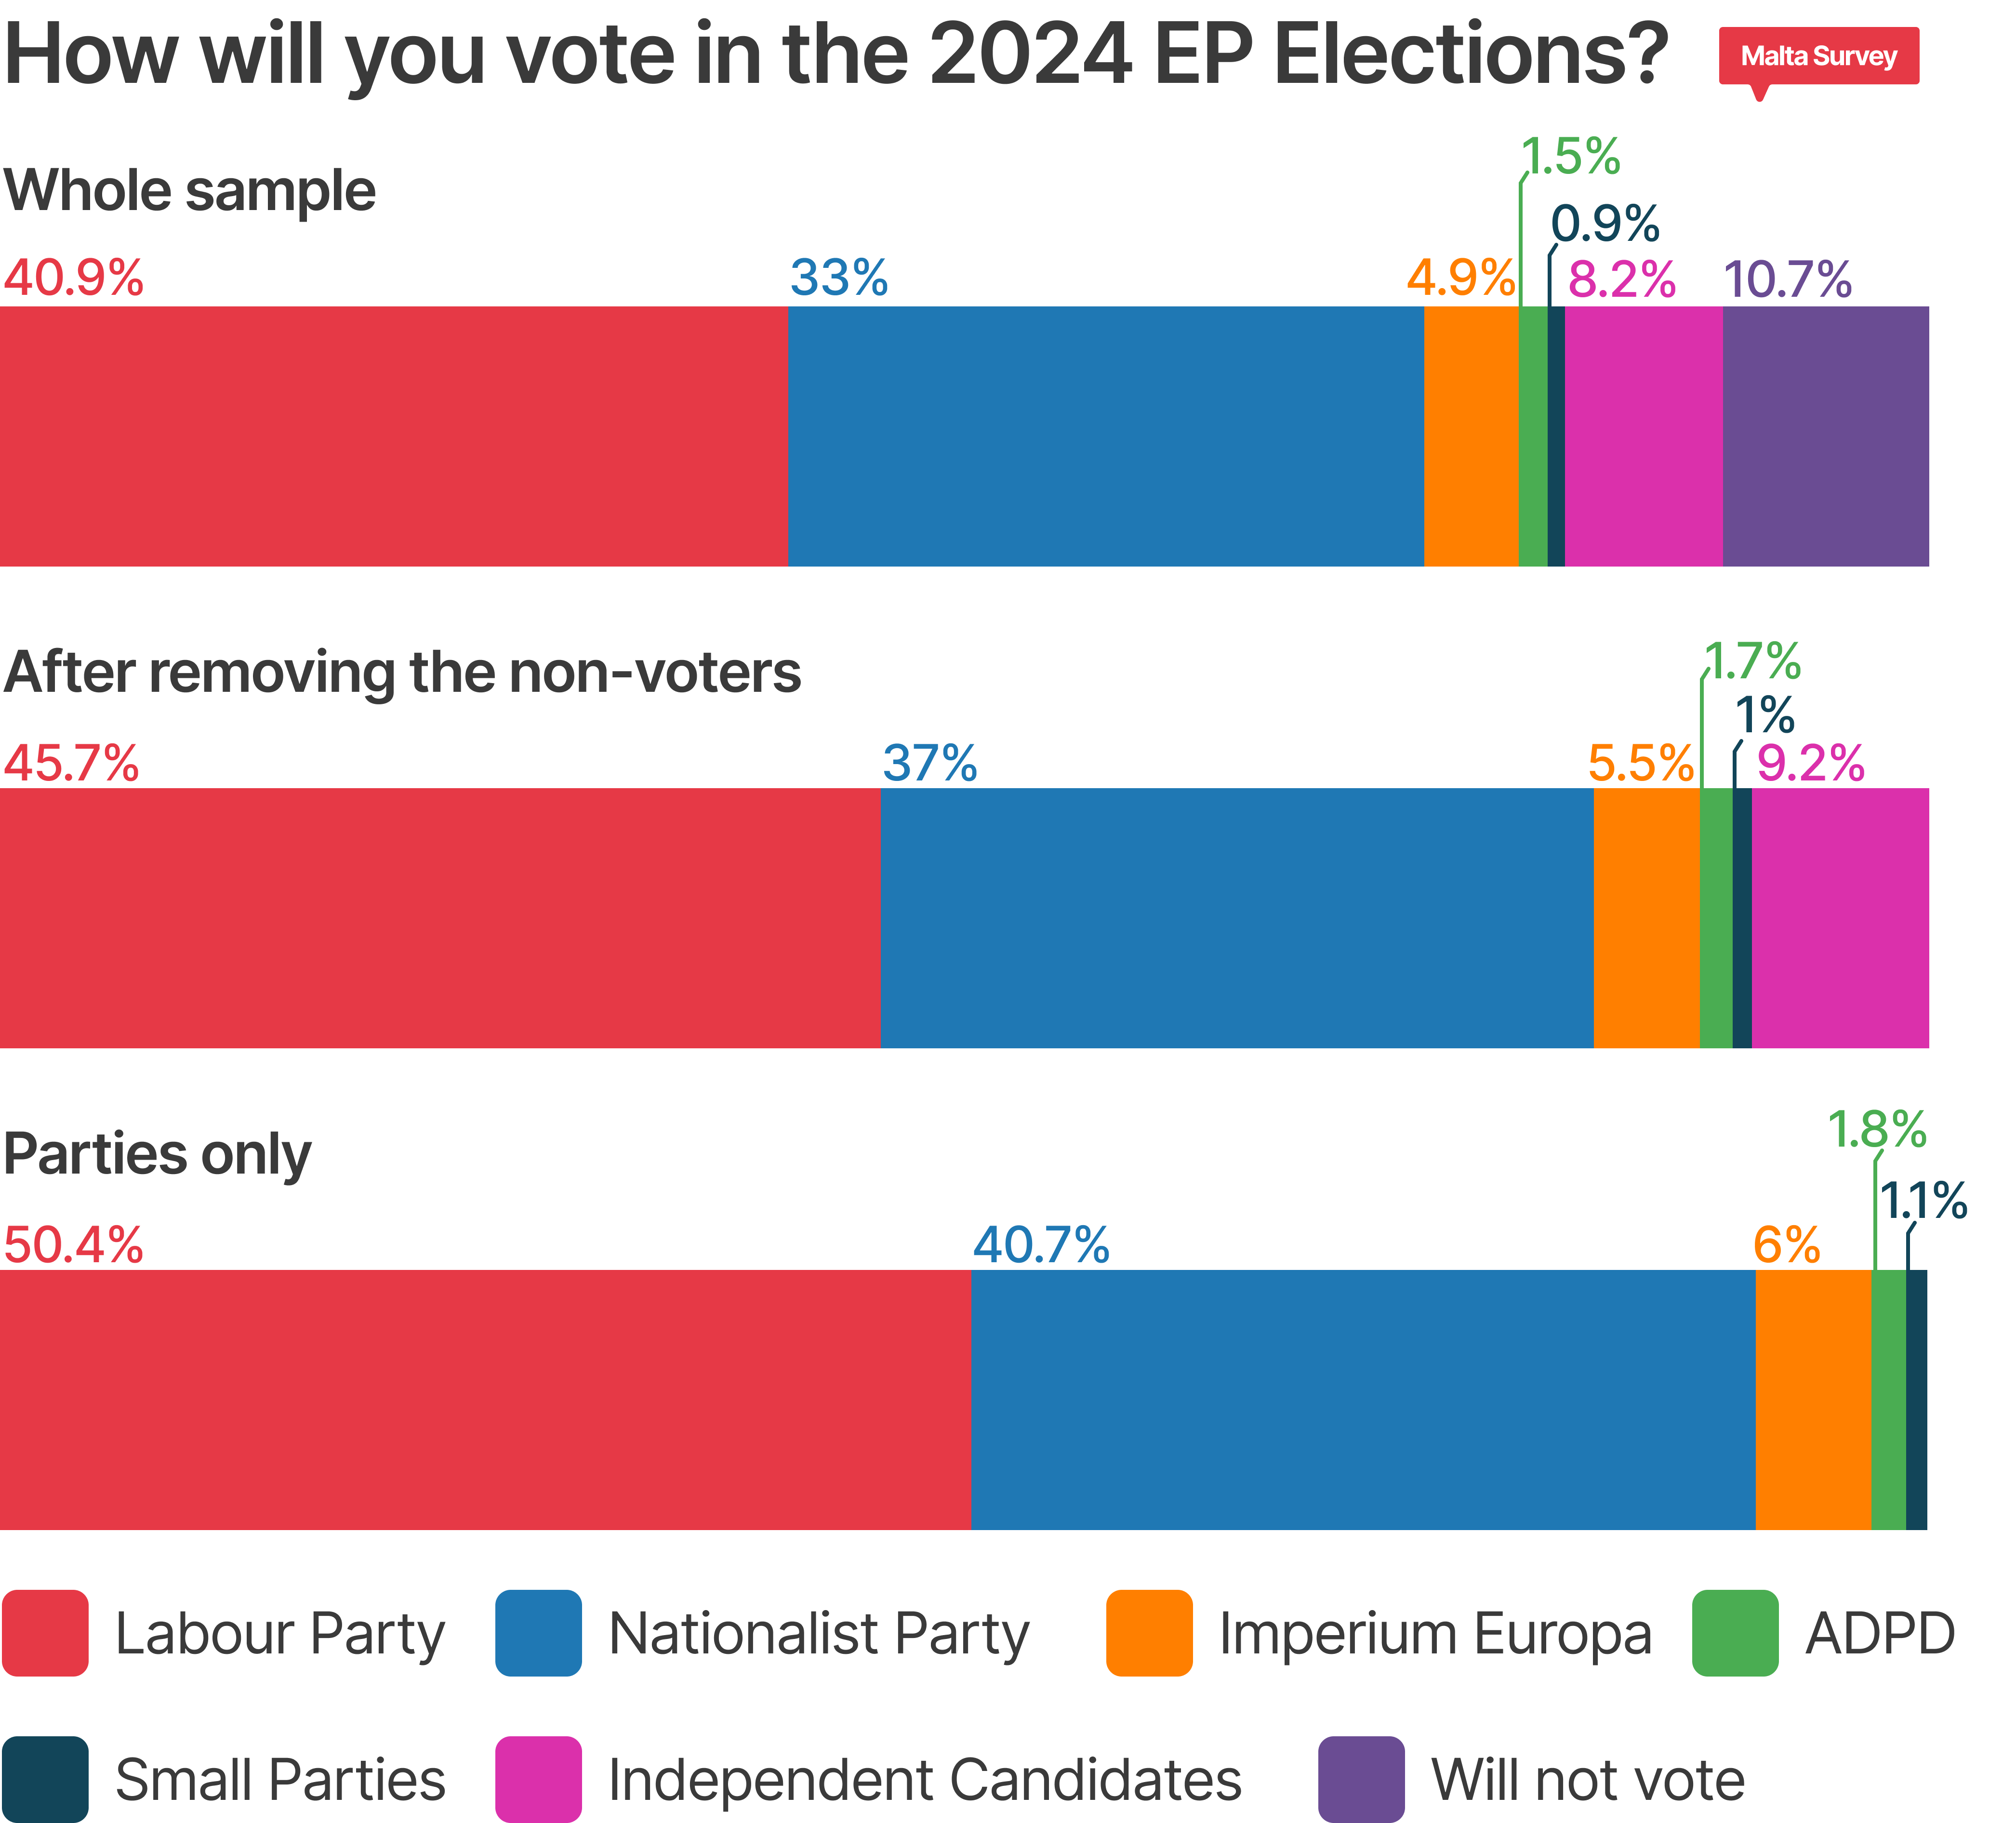
Two versions of perception of voting intentions are made, one where independent candidates are considered and one where only parties are considered. This is because independent candidates do not act in unison or as a party – they are individual entities.
A gap of just under 10% lies between the PL and the PN, occupying 50.4% and 40.7% of voters’ intentions respectively. According to this survey, the gap between the two major political parties has decreased over the last few weeks. Interestingly, 6% of the sample stated their intention to vote for Imperium Europa whilst 2.9% split their voting intentions amongst the other parties. If one considers the independent candidates as their own group, 9.2% of the sample opted to vote for this group. While it is overtly clear that Imperium Europa has gained some momentum, also reflecting the drive towards the far right in other European countries, this is not enough to get any of the candidates on this party ticket to get elected.
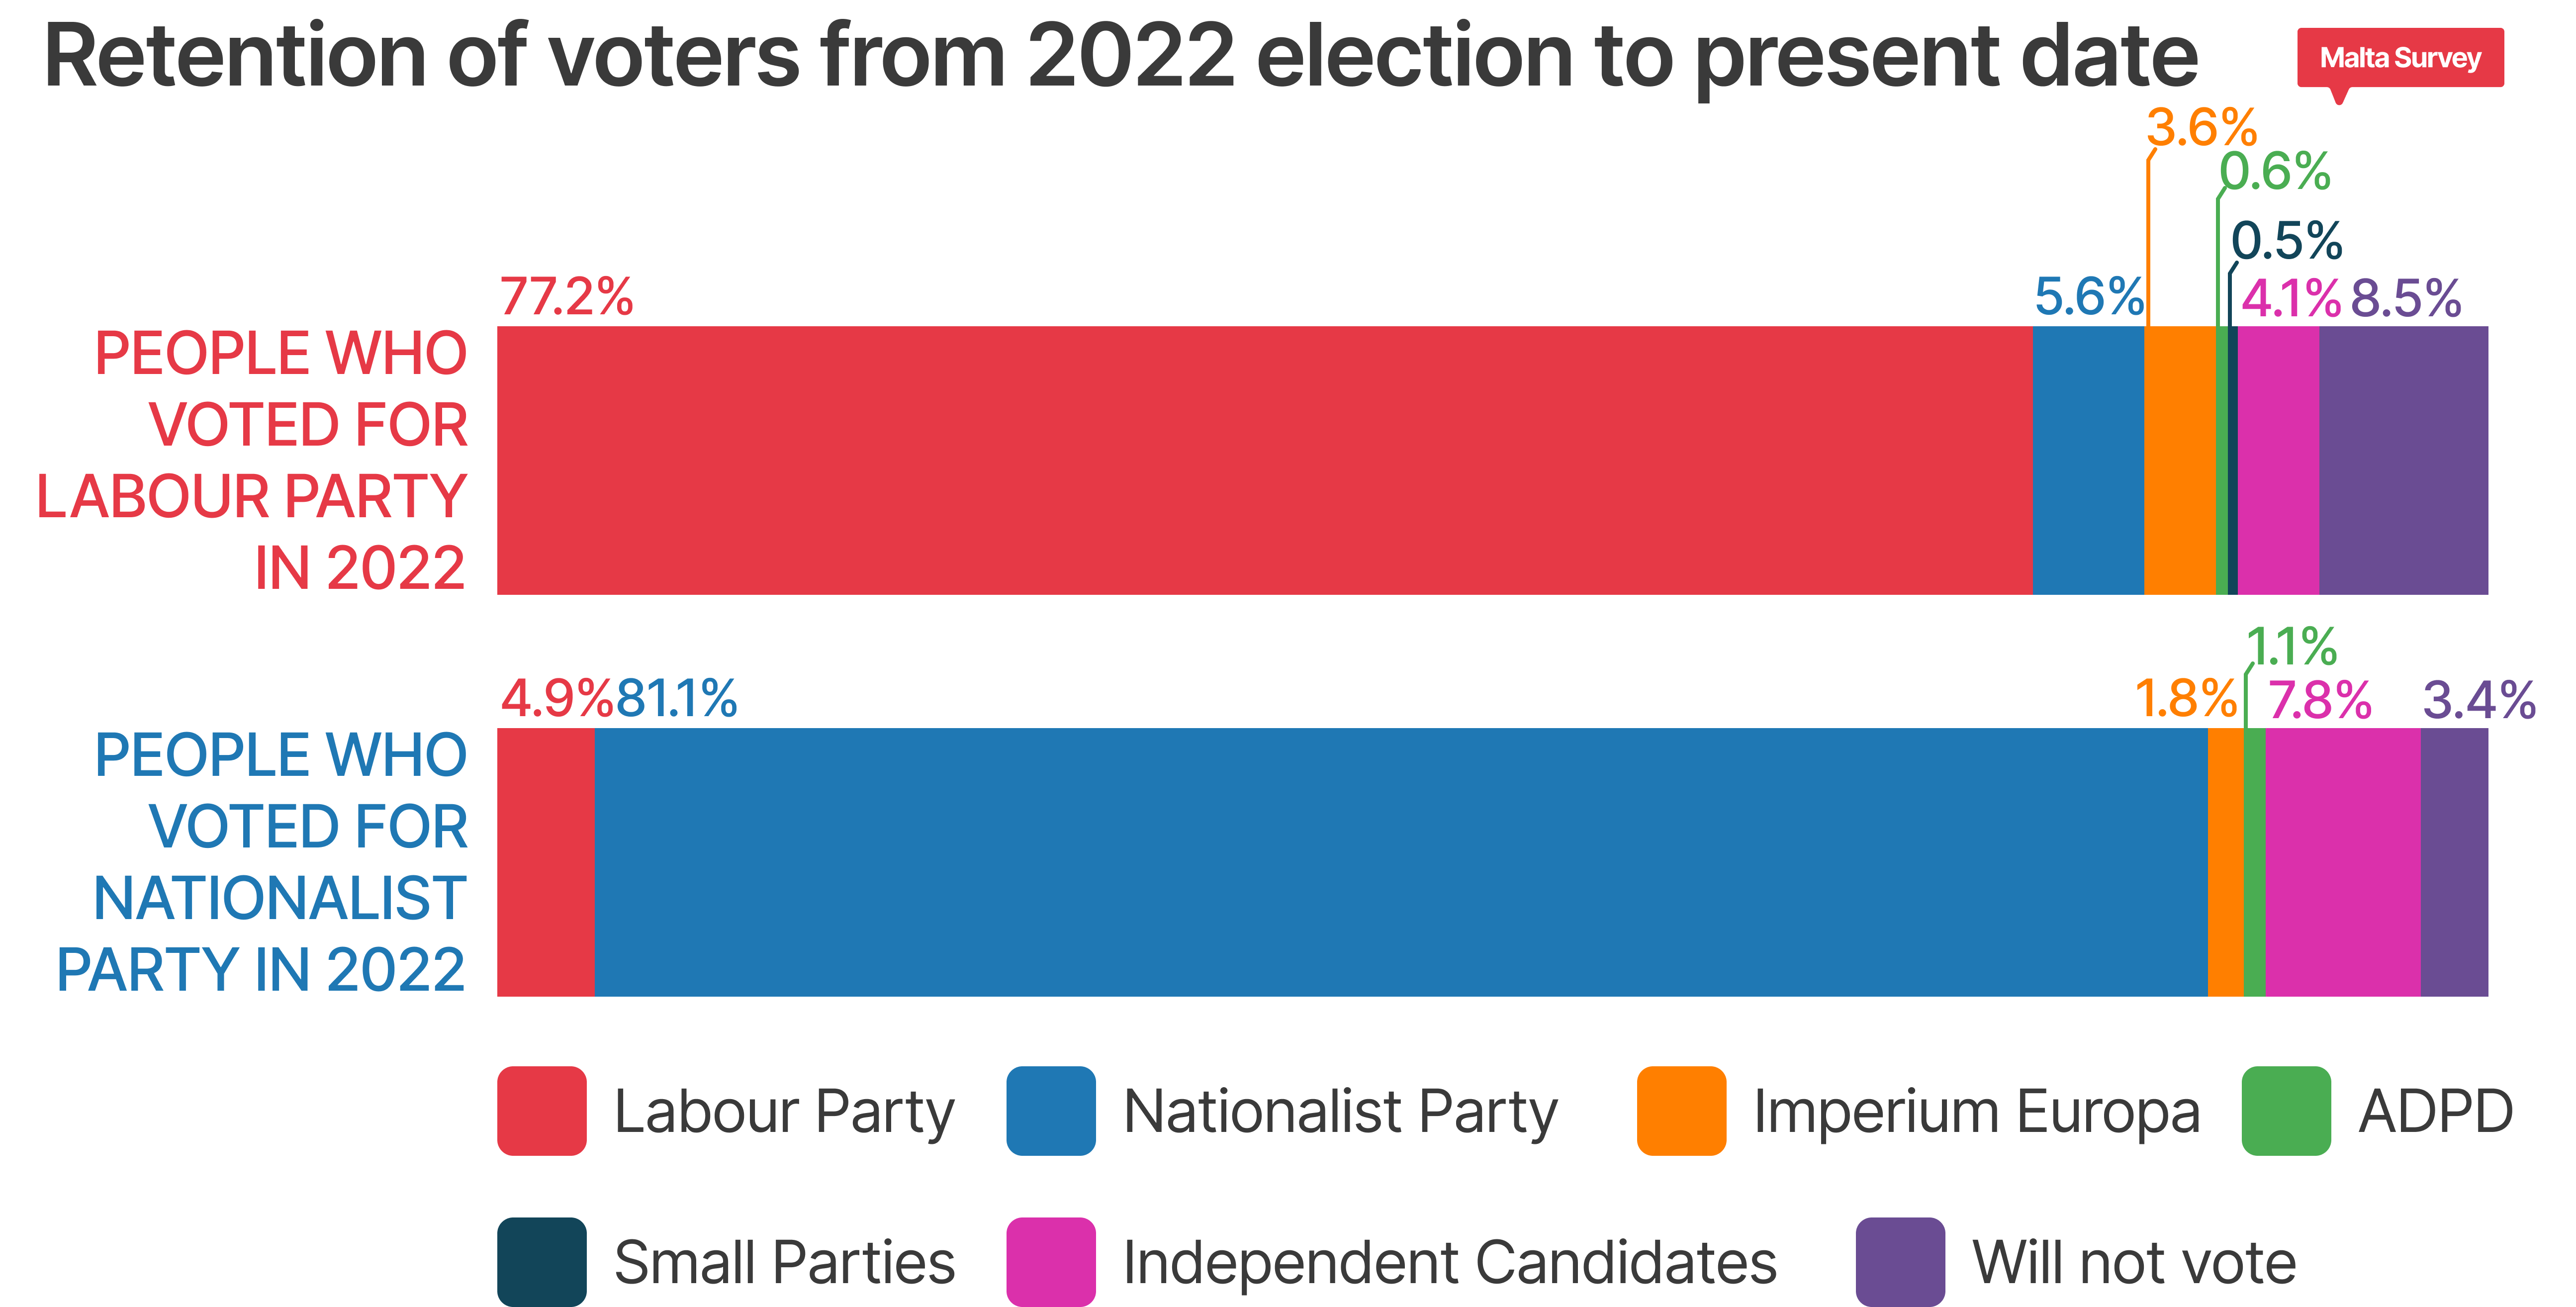
The Labour Party continued to increase its momentum with a further increase of retention to 77.2% from the 74.2% observed in the April 2024 poll. The loss to non-voters decreased from 12.8% to 8.5%. 5.6% of the loss of Labour Party retention is towards the Nationalist Party.
The Nationalist Party also gained momentum, increasing its retention from 79.5% to 81.1% with a roughly similar loss to the Labour Party of 4.9% (from April’s 4.8%).The amount of loss of the Nationalist Party retention to non-voters stayed in the same portion of 3.4% (from 3.8%).
Assessing the Candidate preference
Participants in the sample were asked to rank their top three candidates who had confirmed their intention to run in the election before data collection commenced. The table below displays the results of these preferences.
This survey allowed participants to rate their top three candidates, with the knowledge that six candidates would be elected to the European Parliament. Malta's single transferable vote system enables candidates to receive votes from elected candidates. For clarity, participants who indicated that they would not vote have been excluded.
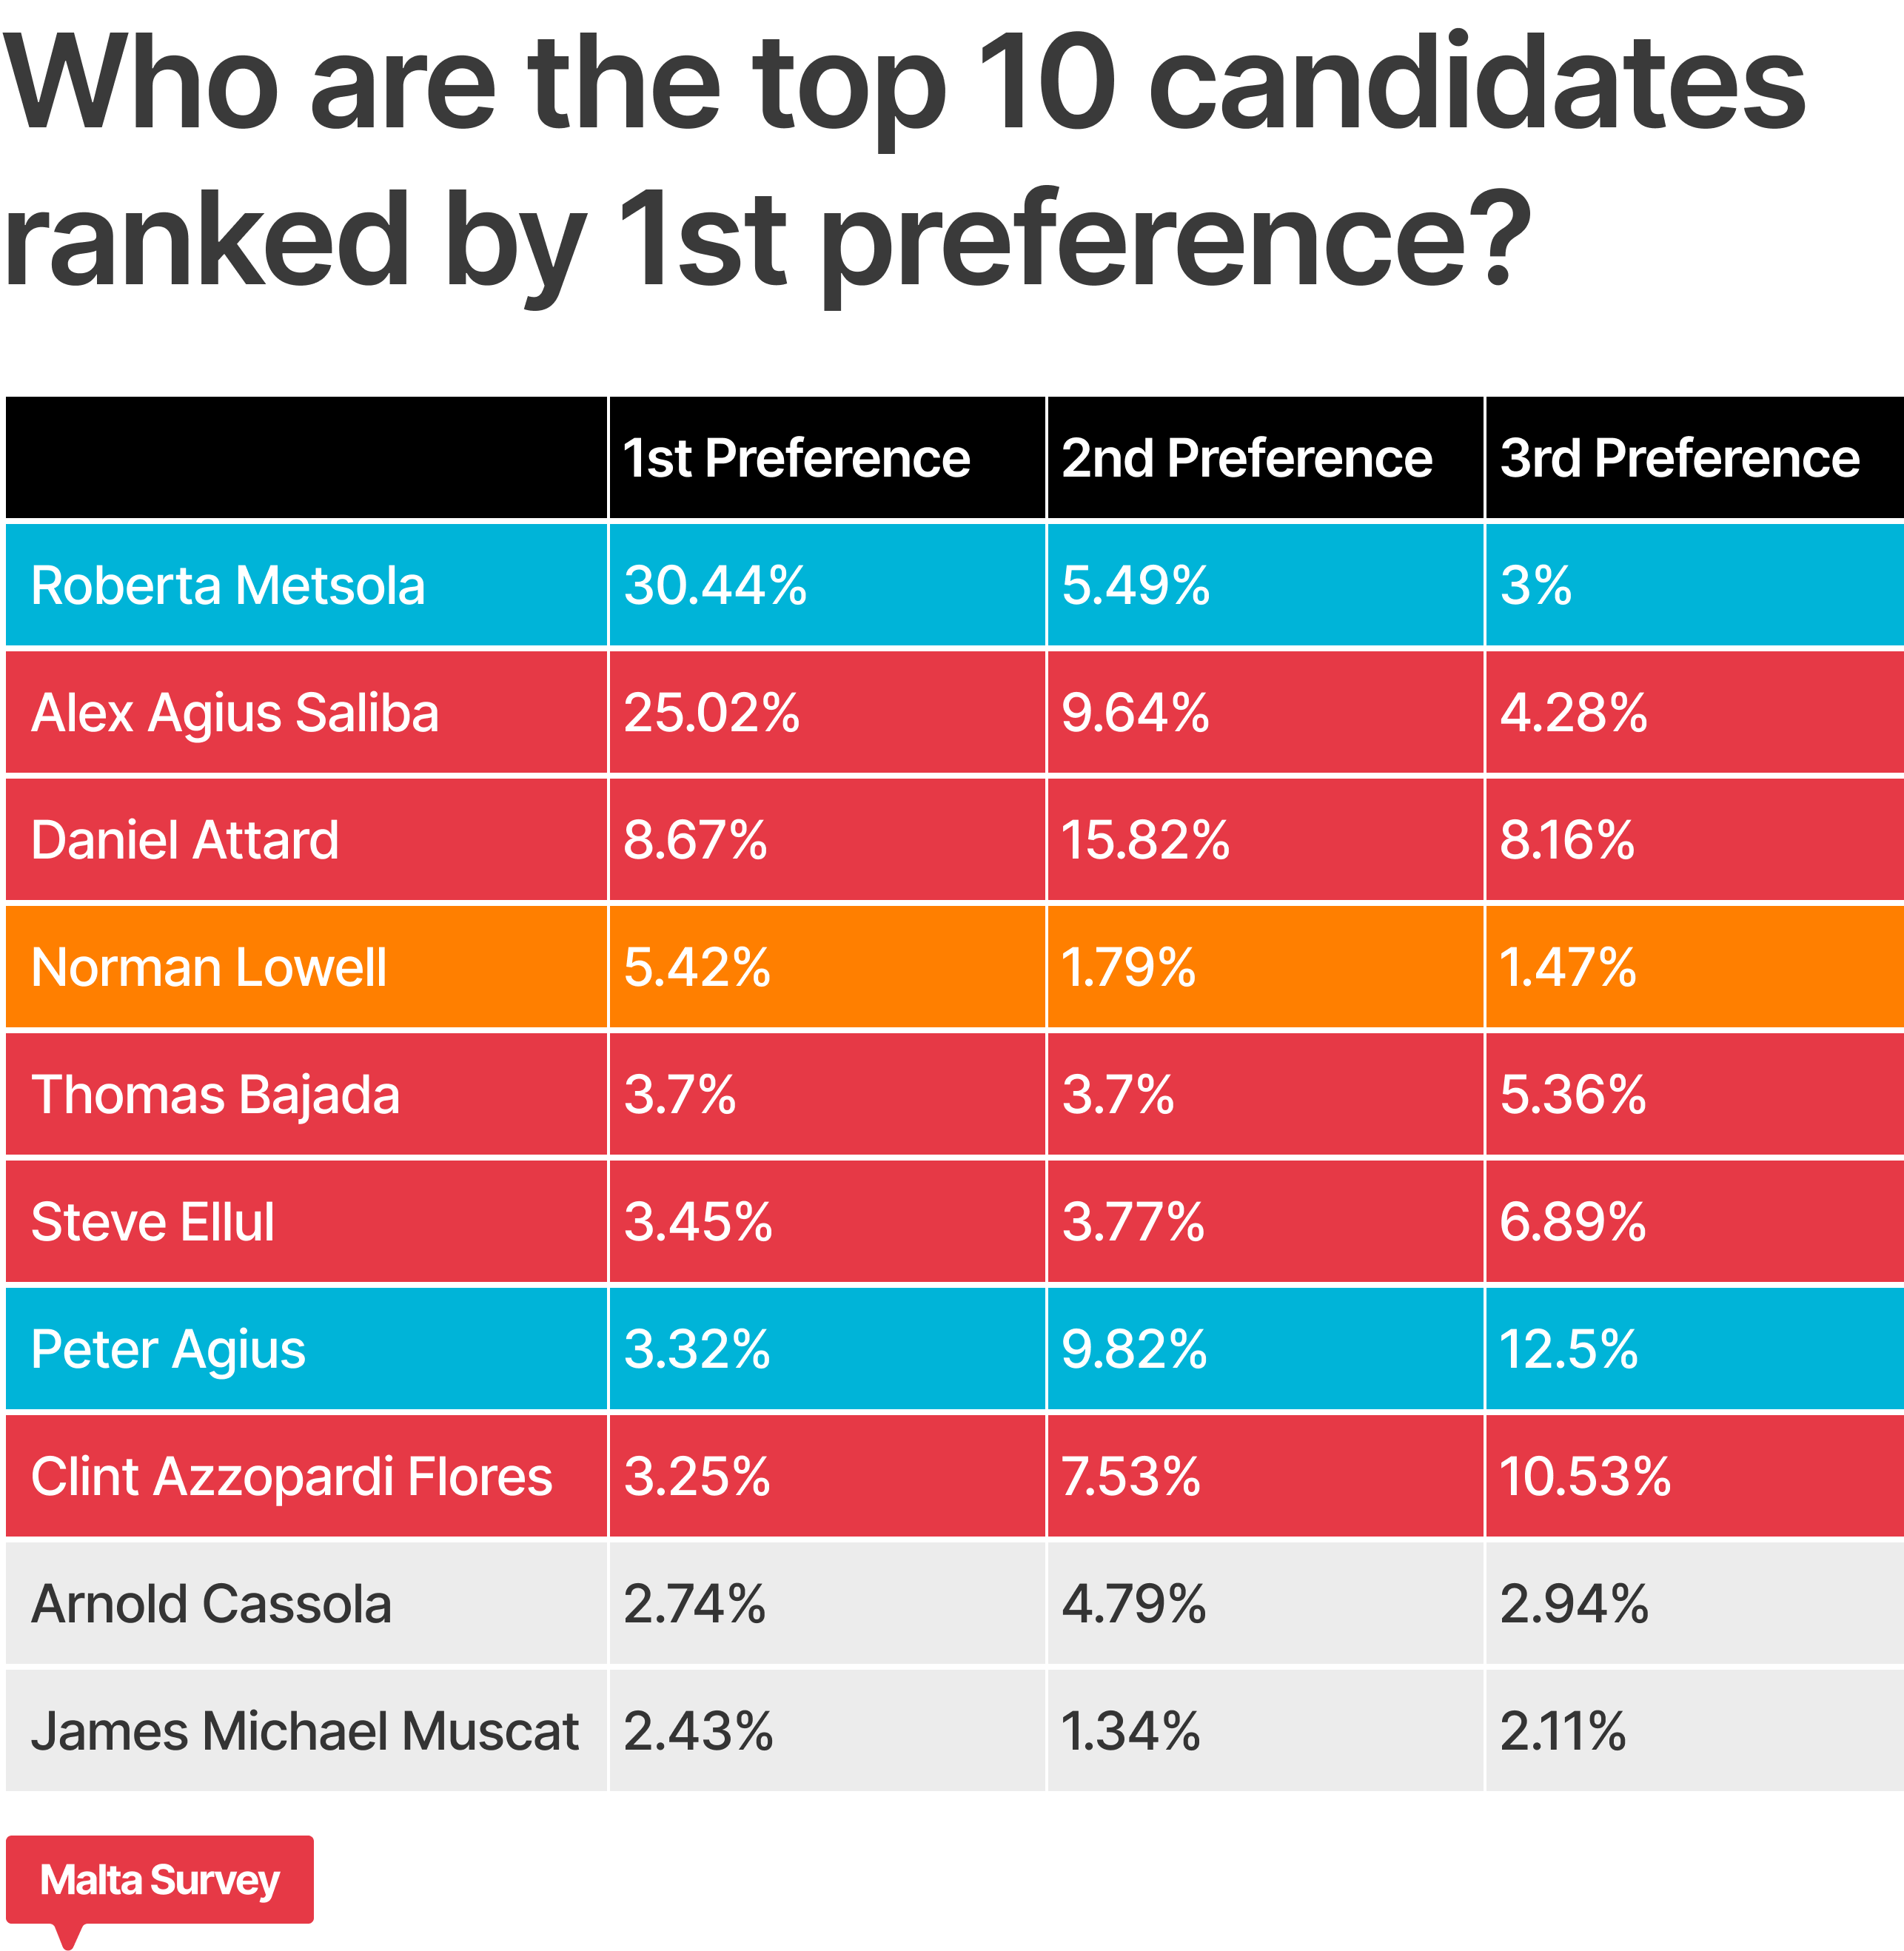
Roberta Metsola has solidified her position as the highest-ranking candidate by 1st preference with a 30.44% portion of first preference amongst the voting participants in the sample. This is a growth of just under 3%. Alex Agius Saliba has strongly retained his position as the 2nd highest ranking candidate by 1st preference with a 25.02% representation amongst the sample, with a reduction of 1% from our April poll. Daniel Attard also maintained his third-place ranking by 1st preference with 8.67%, also reducing 1.5% from our April poll.
Interestingly, Norman Lowell experienced a growth of 1.1% in the first preference ranking from our April Poll. As the positions following the third place were very closely represented, this resulted in an increase of Norman Lowell’s ranking from 6th place to 4th place based on first preference only. There was almost no fluctuation in Lowell’s 2nd preference and 3rd preference quantities.
There is a gap of 1.27% amongst first preference between the remaining top 10 candidates, showing the sparse distribution of first preference amongst the rest of the candidates by the sample participants. The Labour Party has Thomas Bajada, Steve Ellul and Clint Azzopardi Flores in the remaining slots in the top 10 candidates whilst the Nationalist party has Peter Agius. The remaining two candidates are independent – Arnold Cassola and James Michael Muscat.
It is crucial to emphasise that these results do not guarantee one to be elected as member of the European Parliament unless the candidates inherit a significant number of votes after the first and second counts. Achieving such a high vote count may be unlikely for some of the candidates mentioned.
Who will inherit the votes of the elected candidates?
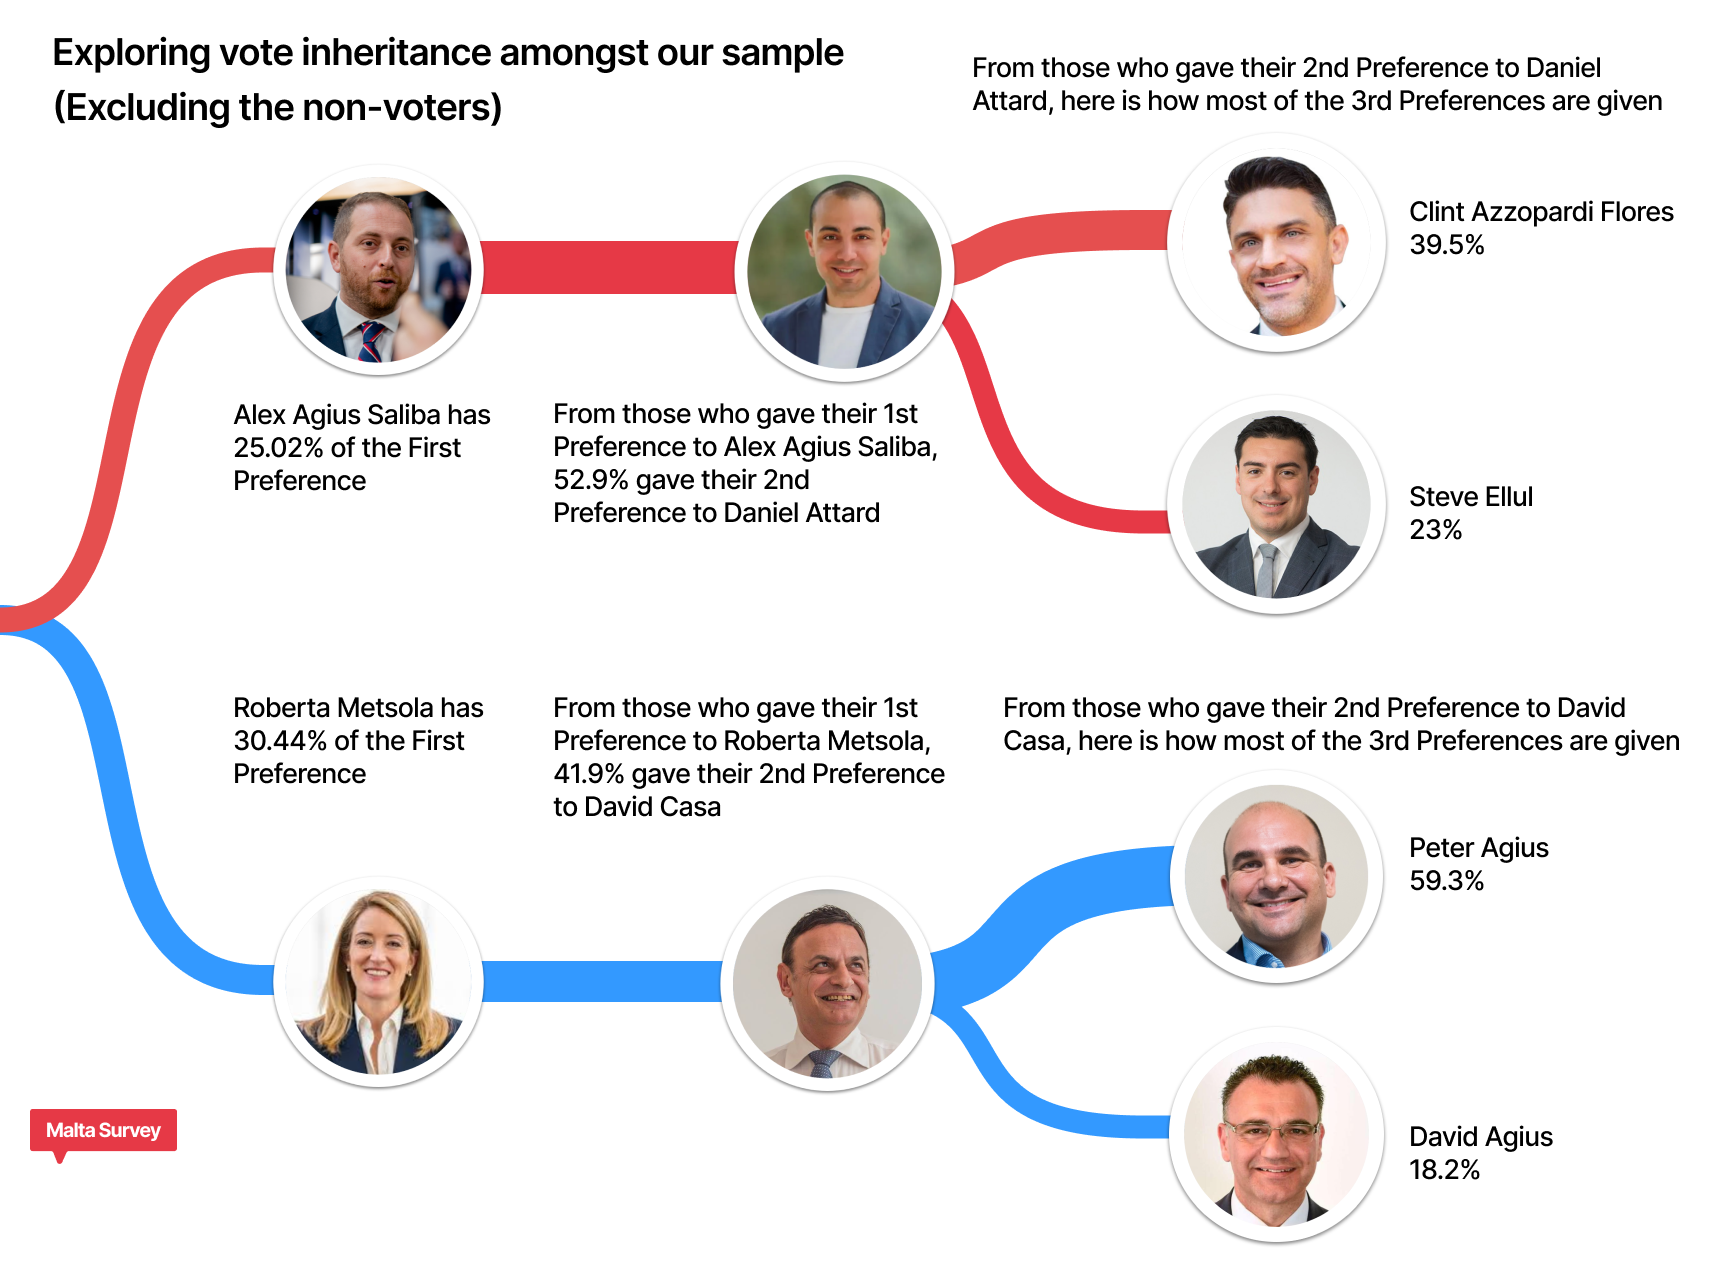
A distinctive aspect of this survey was identifying patterns of vote inheritance, particularly from candidates perceived as the most popular among the electorate. With two candidates emerging as the most favoured, we examined the second and third preferences, as clearly illustrated in the diagram below.
Who will inherit Roberta Metsola's 2nd preference?
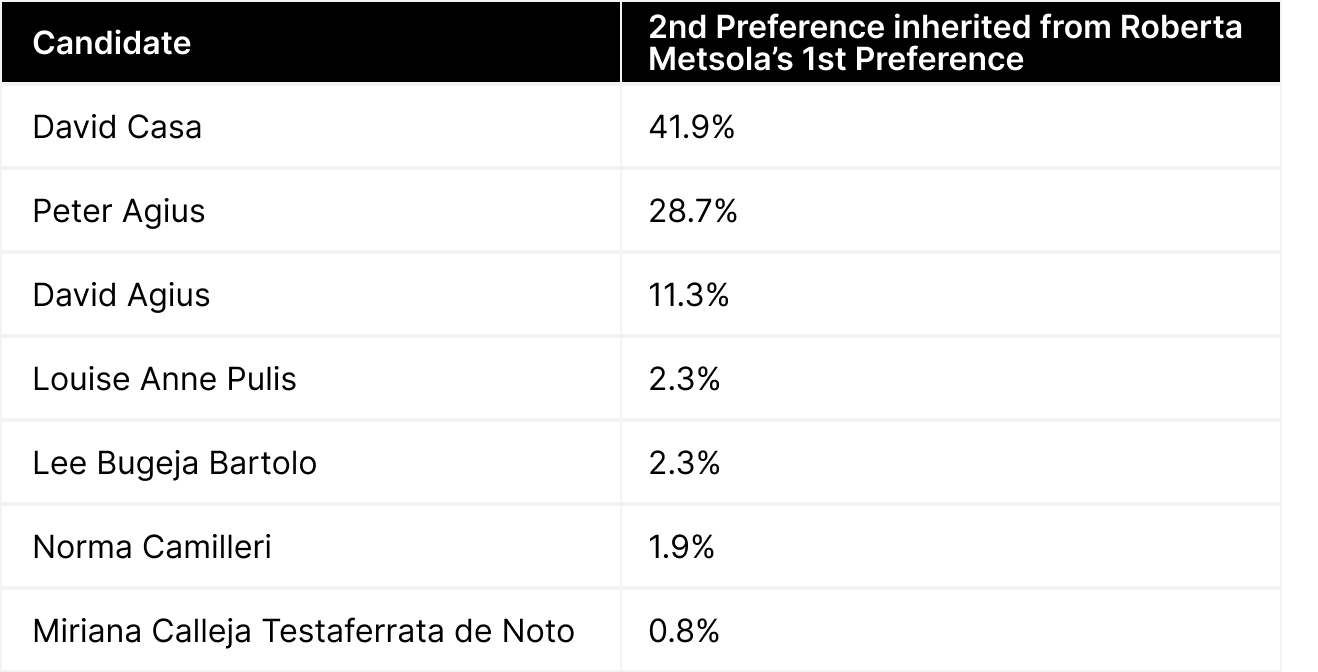
David Casa retains the majority of Roberta Metsola's second preference with 41.9%. Although David Casa was not amongst the top ten candidates based on 1st preference, his total second preference was once more second highest with 13.39%. However, there has been a reduction of 3.2% from our April poll in this manner.
The other noticeable second preference votes will go to Peter Agius with 28.7% (the biggest increase here from 20.8% in our April poll and the third highest 2nd preference over the whole sample with 9.82%) and David Agius with 11.3%.
Who will inherit Alex Agius Saliba's 2nd preference?
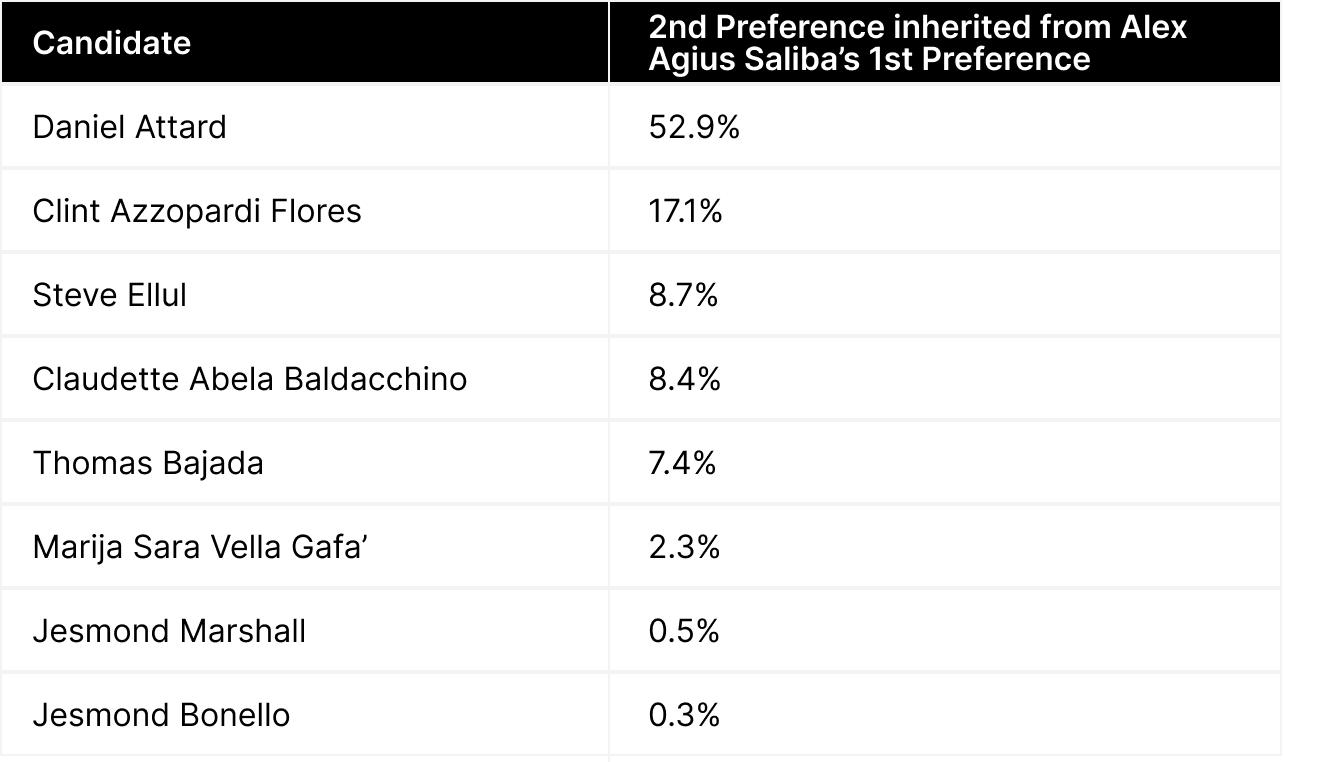
Daniel Attard solidified his majority inheritance of 2nd preference from Alex Agius Saliba’s 1st preference. Attard has the highest portion of sample-wide second preference (15.82%). This is the largest growth of inheritance from our April poll with a 9.7% increase of inheritance from Agius Saliba. Clint Azzopardi Flores maintained his 2nd place inheritance position with 17.1% (a reduction of 0.9%) and Steve Ellul maintained his 3rd place inheritance position with 8.7% (a substantial reduction of 7.7%). Claudette Abela Baldacchino retained her 4th place inheritance position from Agius Saliba at 8.4% (a reduction of 3.5%) and Thomas Bajada retained his 5th place inheritance position with 7.4% (an increase of 4.2%).
Based on the survey results, and considering that David Casa and Daniel Attard will inherit a substantial portion of second preferences from Roberta Metsola and Alex Agius Saliba’s first preferences respectively, we investigated the allocation of third preferences from Casa and Attard. This analysis assumed that both Casa and Attard will have reached the required quota by this stage.
Who will inherit David Casa's 3rd preference?
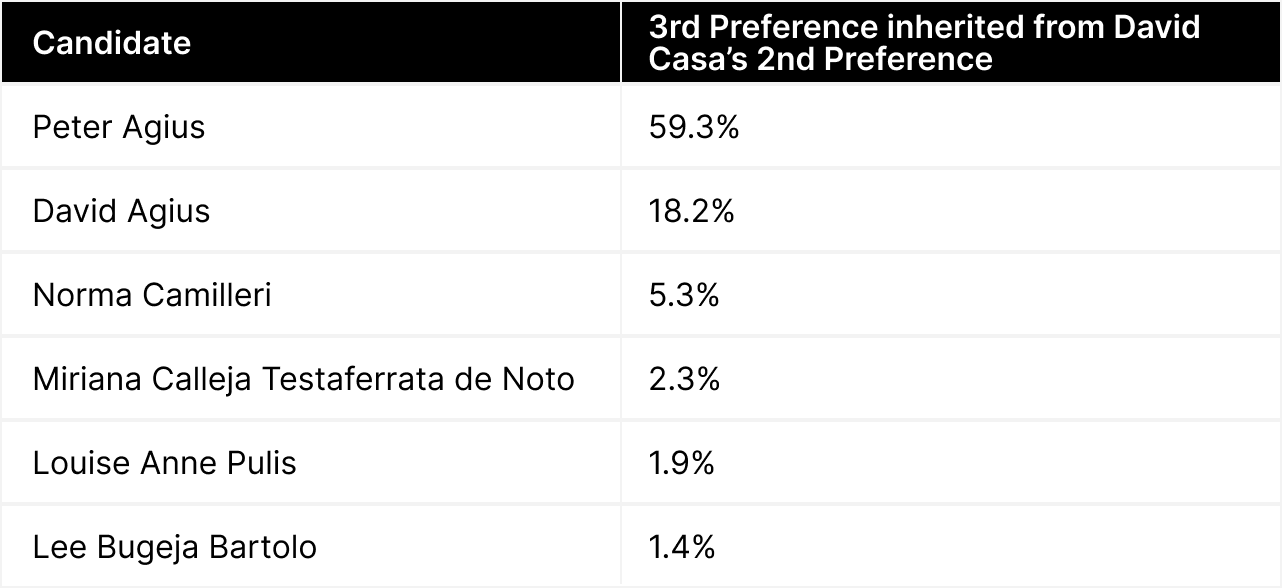
Peter Agius maintained his leading position to inherit the third preference from David Casa’s second preference at 59.3% (the largest third preference inheritance increase of 12.5%). David Agius maintained his second-place position at 18.2% (a reduction of 7.9% from our April poll).
Who will inherit Daniel Attard's 3rd preference?
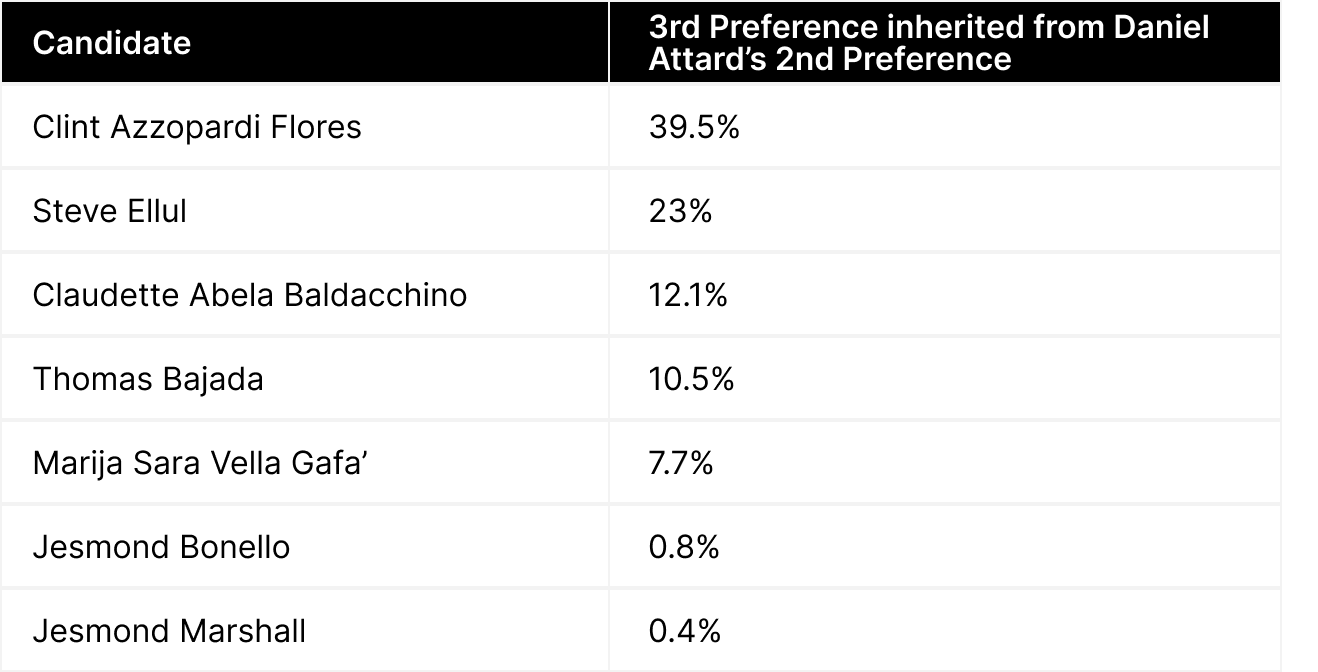
Clint Azzopardi Flores remained to be the top inheritor of the third preference from Daniel Attard’s second preference at 39.5% (an 8.2% increase in momentum). Steve Ellul remained in second place here at 23% (an increase of 2.3% from the April poll).
Our sample's trust amongst party leaders
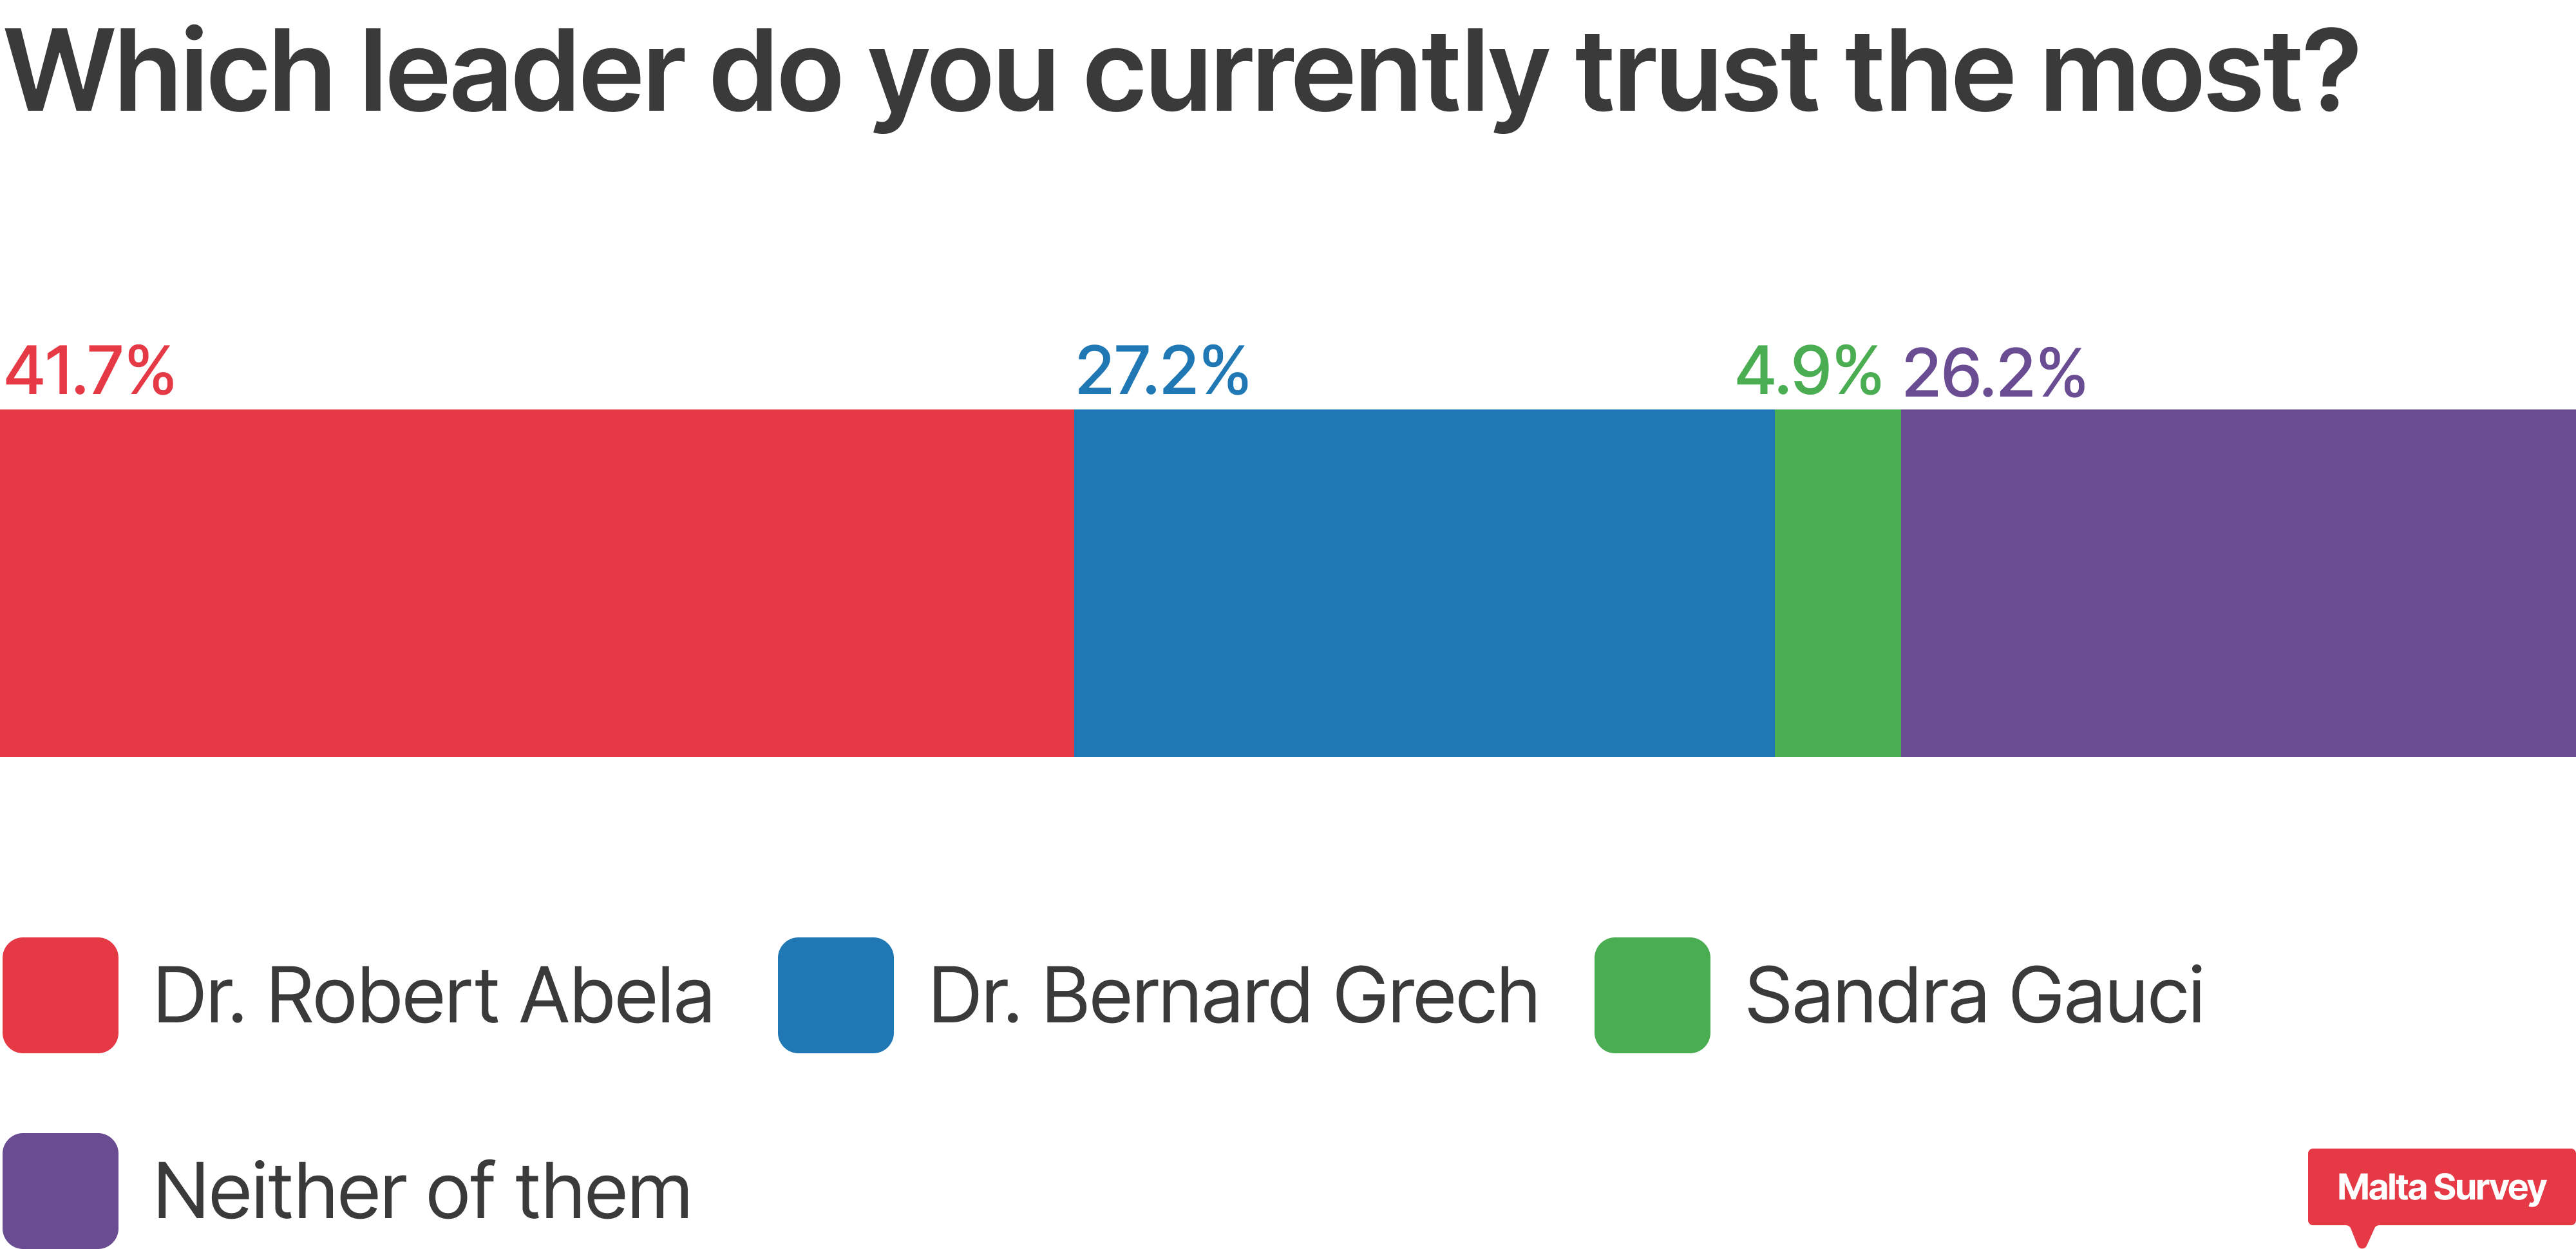
Dr. Robert Abela retains his strong position of trust at 41.7% (a 3% reduction from our April poll), whilst Dr. Bernard Grech increased his trust ratings up to 27.2% (a 3.9% increase form our April poll). Trust in Sandra Gauci decreased from 6.1% in April's poll to 4.9%. It is noteworthy that 26.2% claimed they do not have trust in any party leader.
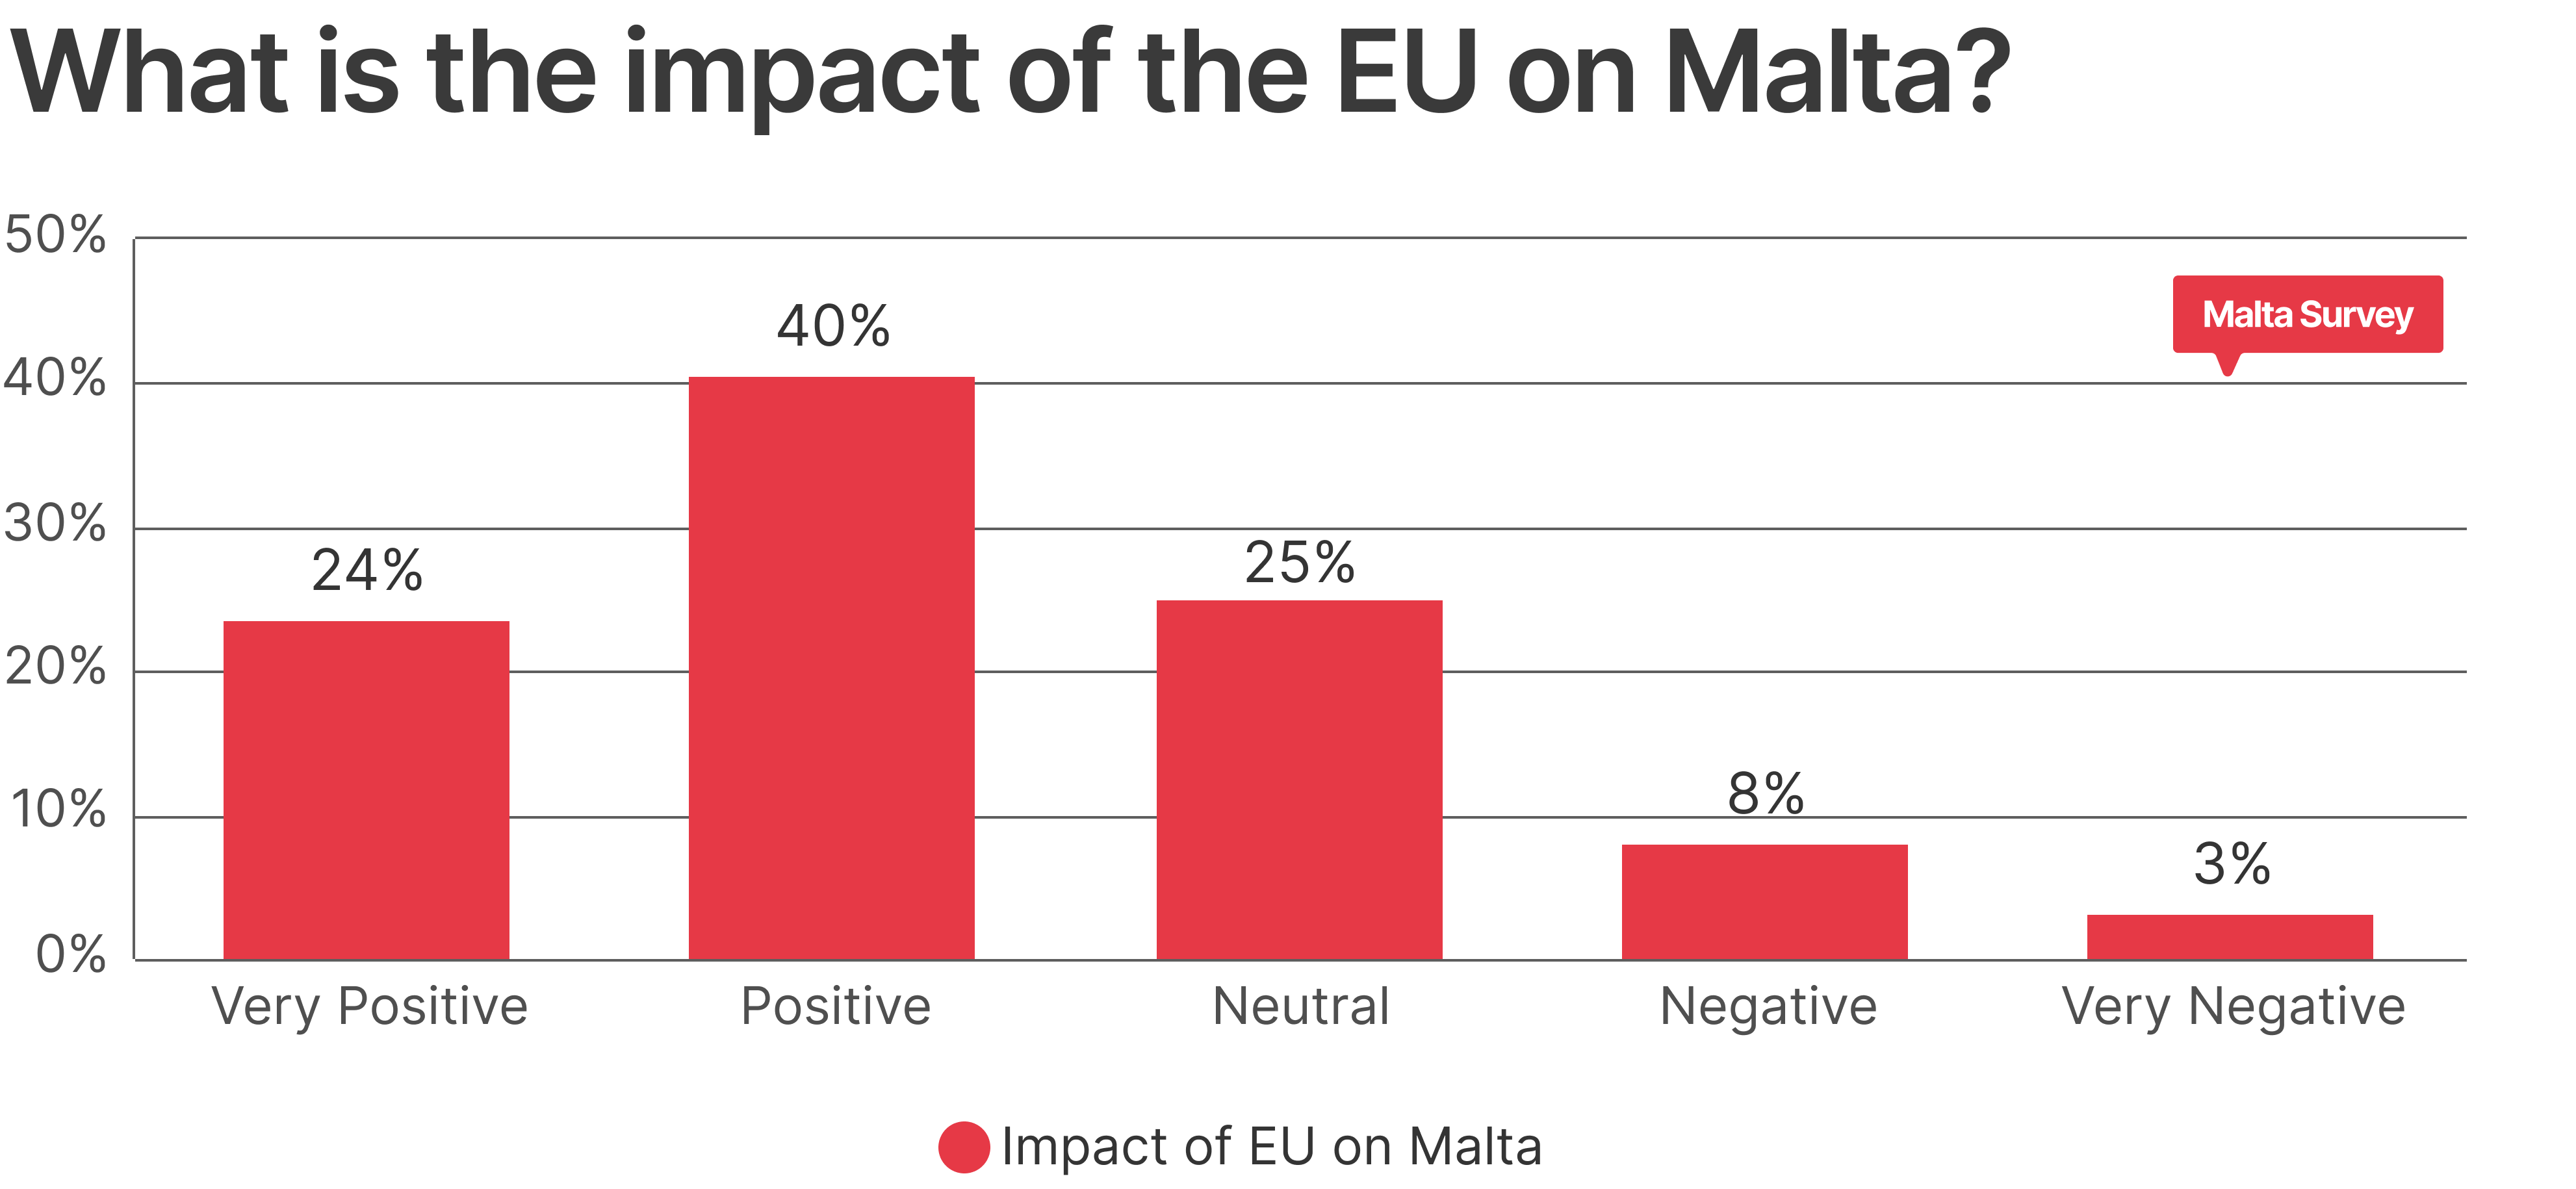
Our sample's thoughts on the EU
Our participants were asked for their perception of how the EU impacts Malta. The overall conclusions of the measure were in line with the April poll with a clear affirmation that the EU positively impacts Malta with 40%, (an increase of 4.1%) answering “Positively” and 24% answering “Very Positively” (a 7.4% increase). On the other hand, 25% have a neutral stance on the matter followed by 8% and 3.1% who think the EU has a “Negative” and “Very Negative” impact respectively.
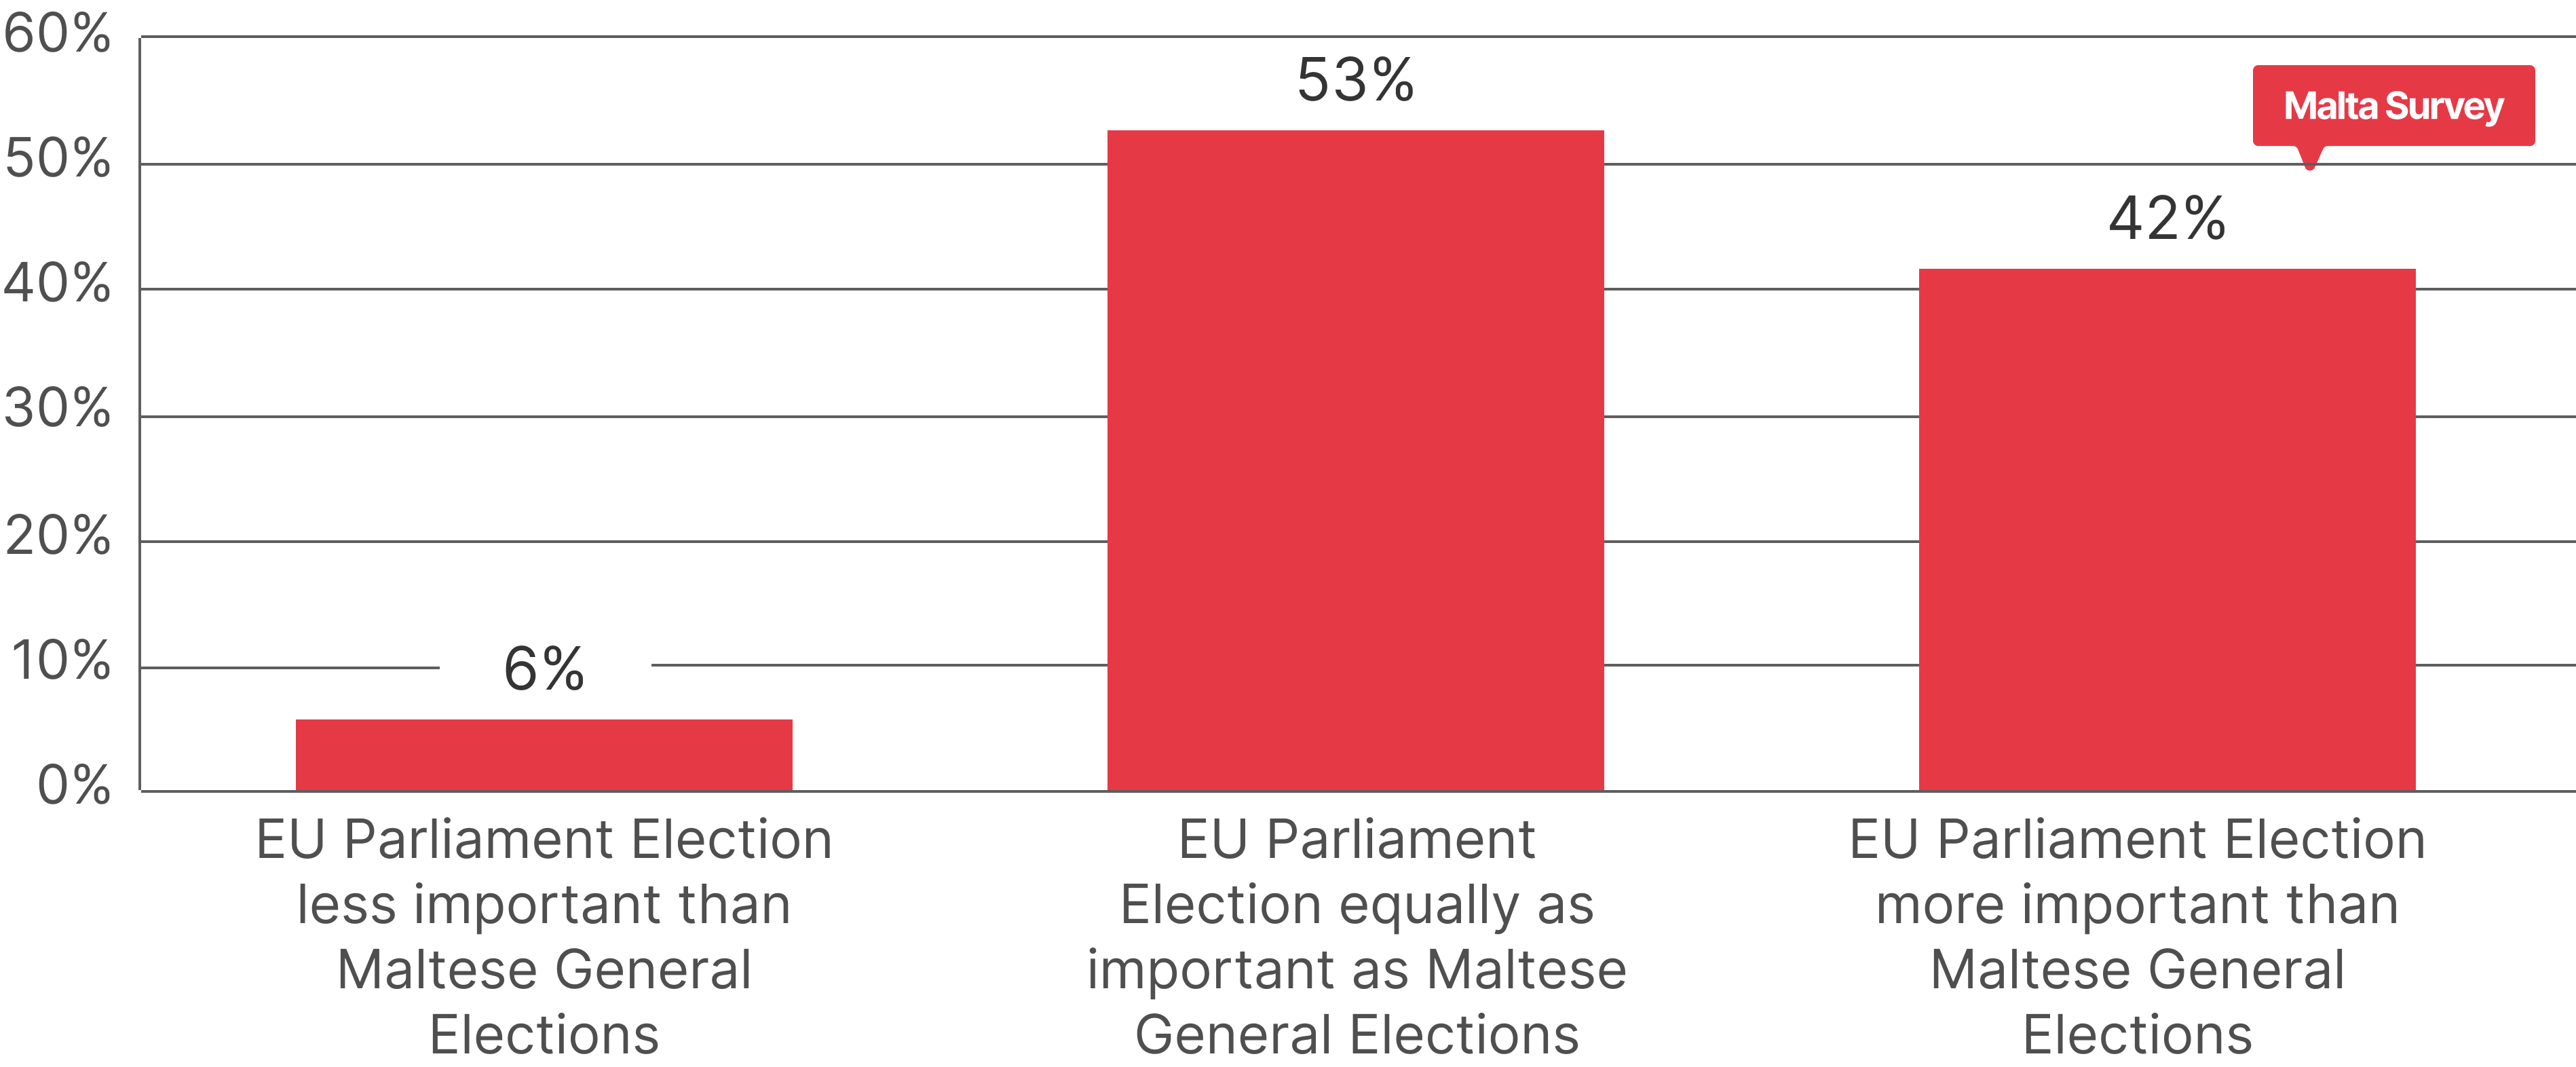
When asked about the relative importance of the EP Elections compared to the Maltese General Elections, 52.7% of the sample considered both elections equally important. Meanwhile, 41.6% deemed the European Parliament elections less important than the General Elections, and only 5.7% viewed the upcoming elections as more important. These findings are relatively consistent with the results from our April poll.
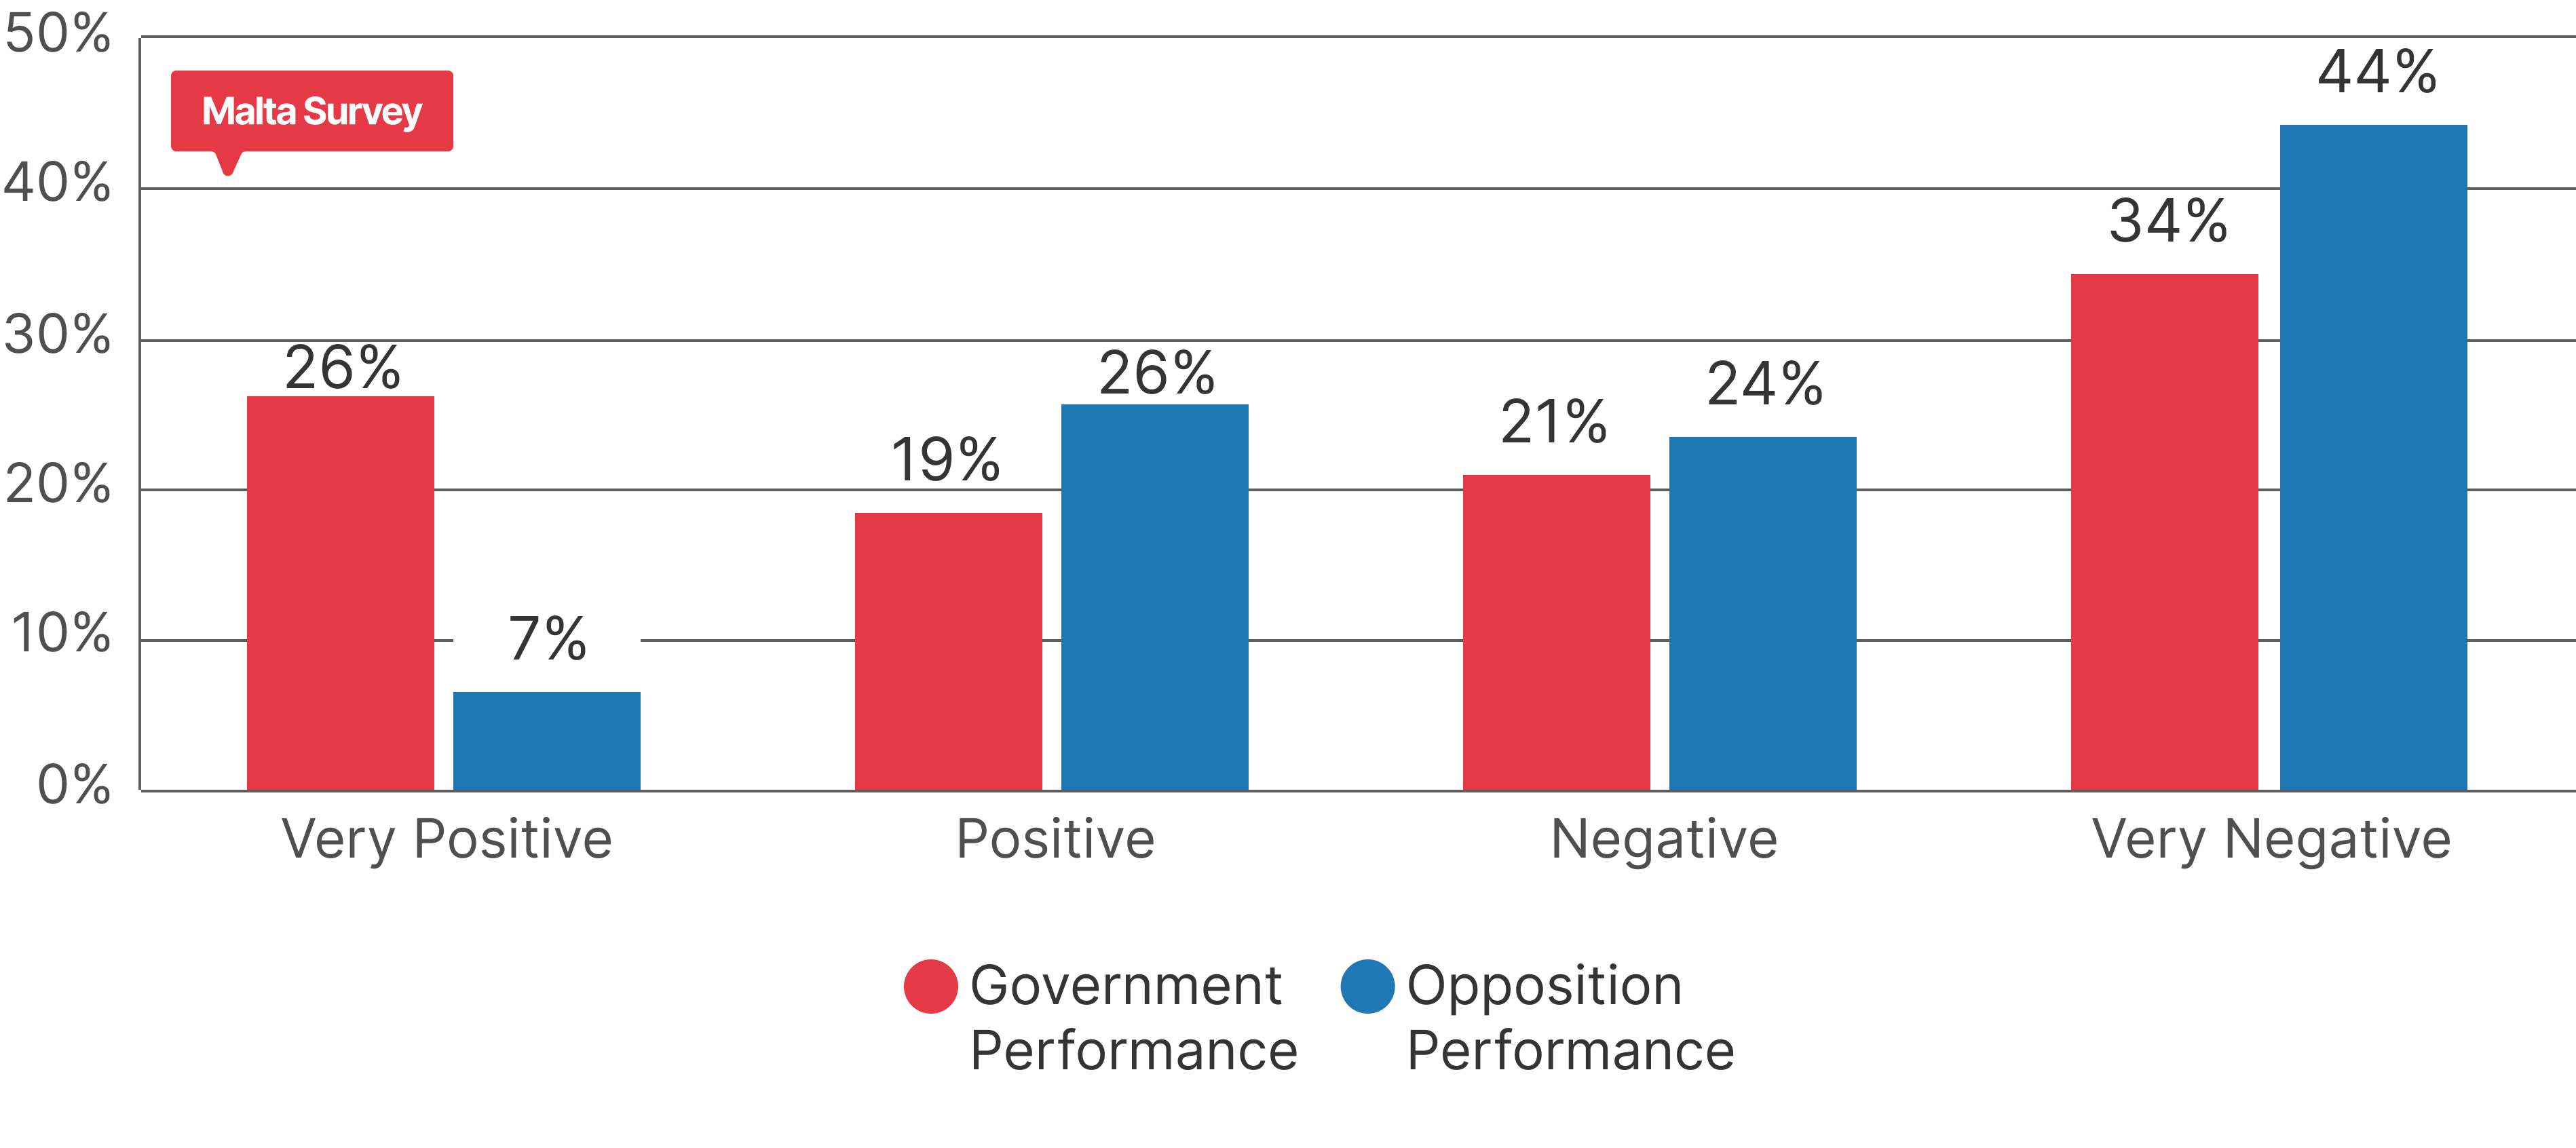
Our sample's thoughts on the performance of the Government and the Opposition
The measure on Government's as well as the Opposition's performance outline some interesting findings. The survey presents a situation where 44% of the respondents have claimed a positive outlook on Government performance (adding together the Very Positive and Positive). On the other hand, 55% of the respondents (adding 21% and 34%) have a negative outlook on Government's performance.
Similarly, 33% of the respondents (7% and 26%) have a positive outlook on the Opposition’s performance albeit the fact that generally the party in opposition would be regarded as a government in waiting. 68% (adding 24% and 44%) have rated the opposition’s performance negatively. This is somehow also related to the leader’s overall performance.
Notably, this survey was carried out during the results of the magisterial inquiry. Interestingly, despite the eventful week, the shift towards the opposition party has been minimal.