
Budget 2025 Expectations

Article byIDEA Research TeamPublished on Fri Oct 25 202413 minute read
Executive Summary
Like any other year, this year’s budget raises mixed feelings among the general public. A substantial part of the popular are optimistic that Government will address what is needed while the majority remain concerned if Government would live up to its expectations.
This year’s pre-budget survey shows that with improved levels in the standard of living, the next most important attribute to look for is a better environment to live in. Coupled with ideas on better Government spending, this year’s pre-budget survey reinforces the idea that people still hold Government accountable for its action in controlling its spending.
Methodology
This online survey was carried out between the 3rd and the 14th of October 2024. The survey was hosted on Malta Survey’s website - www.maltasurvey.com. Notice of its release was given through digital advertisements on social media platforms. No direct targeting or use of any pre-known datasets was done, thus protecting any identification of the sample’s participants. Each submission was verified through a series of automated checks and guards to prevent duplicate responses and ensure the legitimacy of the data. Participants had the option to carry out the survey either in Maltese or English and effort was made to ensure that all questions were neutral and non-leading. All submissions were gathered through Malta Survey’s platform and the anonymity of the sample base was ensured. Analysis was done using data science tools.
Sampling & Weighting
Sampling was carried out using stratified methods to mirror the demographic composition of Malta’s electorate, including age, gender, region and education. Following sampling completion, statistical post-stratification weighting was applied to adjust for any discrepancies between the sample and the general population, ensuring that the results accurately reflect the views of the electorate as closely as possible.
Data Security and Privacy
Malta Survey adhered to strict protocols to protect the confidentiality and integrity of survey responses. All data transmissions are encrypted and no personal information is stored in the survey’s dataset.
Limitations and Disclaimer
Whilst Malta Survey’s digital polling methodology is designed to minimise errors and biases, it is important to acknowledge potential limitations. The reliance on digital technology means that any individual without internet access may be potentially underrepresented. Despite efforts to ensure a representative sample, the self-selecting and fully voluntary nature of the respondents could introduce some level of response bias. However, like all survey methods, it is subject to certain inherent limitations that are diligently mitigated through the design and execution of the polling process.
Margin of Error
As of April 11, 2022, Malta’s population of people aged between 16 years and over stood at 447,456. With a sample size of 862 duly filled surveys, the findings of this study has a margin of error of 3.3% at a 95% confidence level. Specific sub-divisions by demographics and/or specific cohorts will have larger margins of error due to the smaller size of the sample portion considered.
Findings
Demographic Analysis of the Sample Population
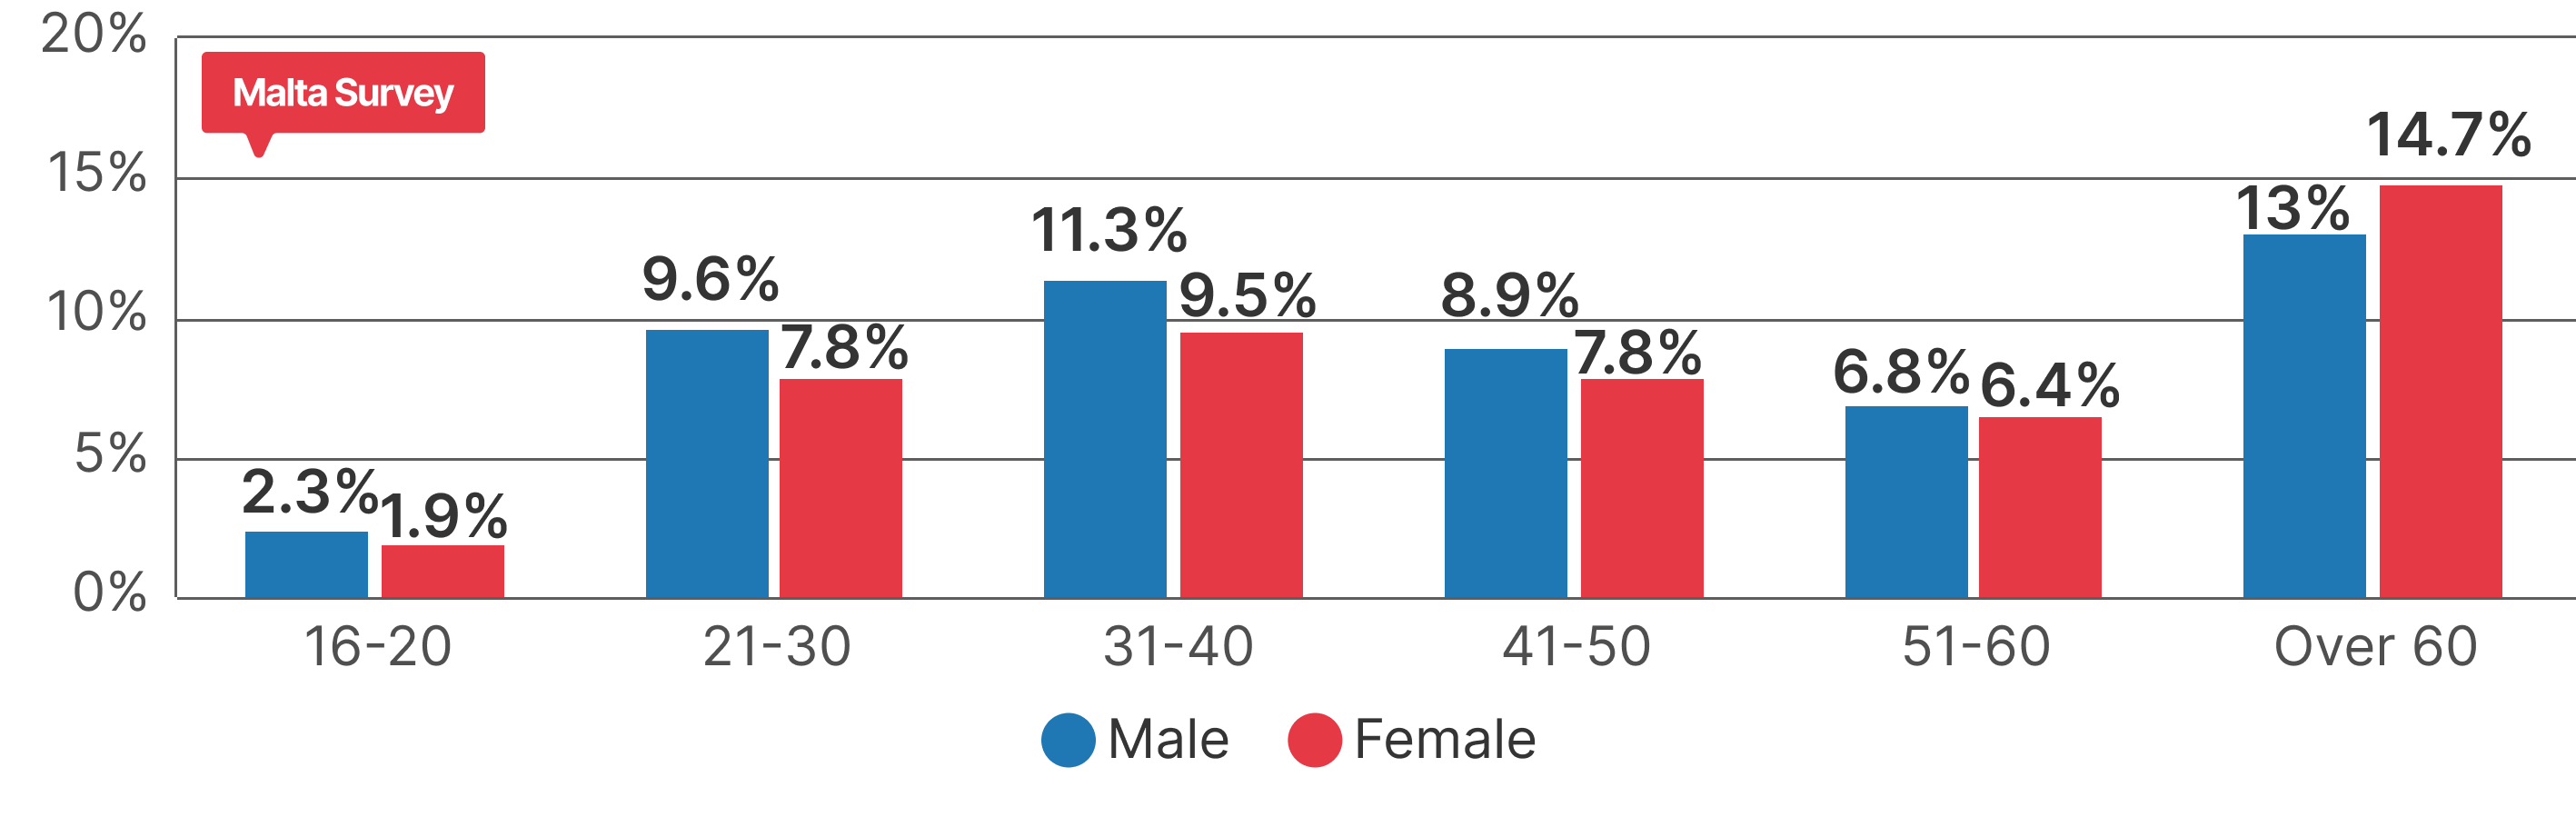
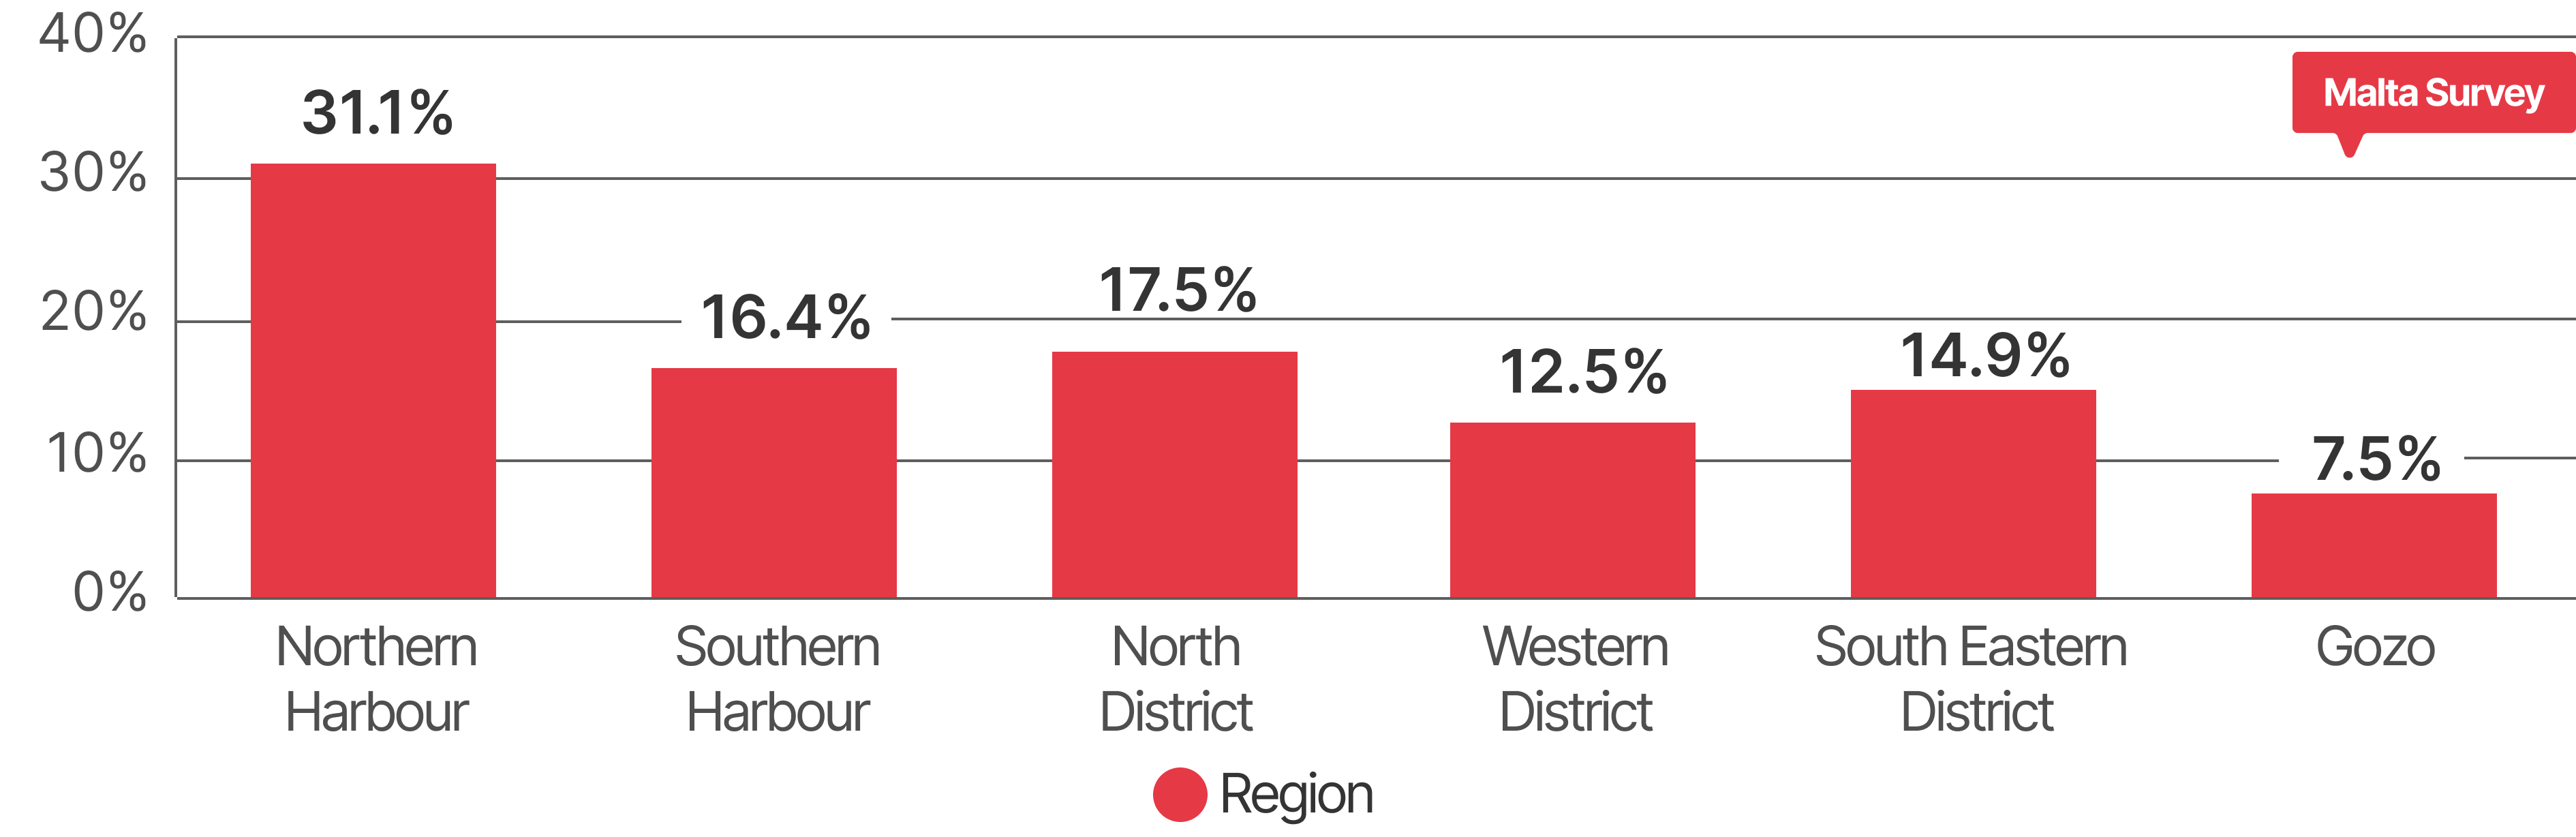
The sample includes 862 participants, with 52% males and 48% females, distributed across different age groups. The regional distribution indicates that the sample is representative of the population of the Maltese islands.
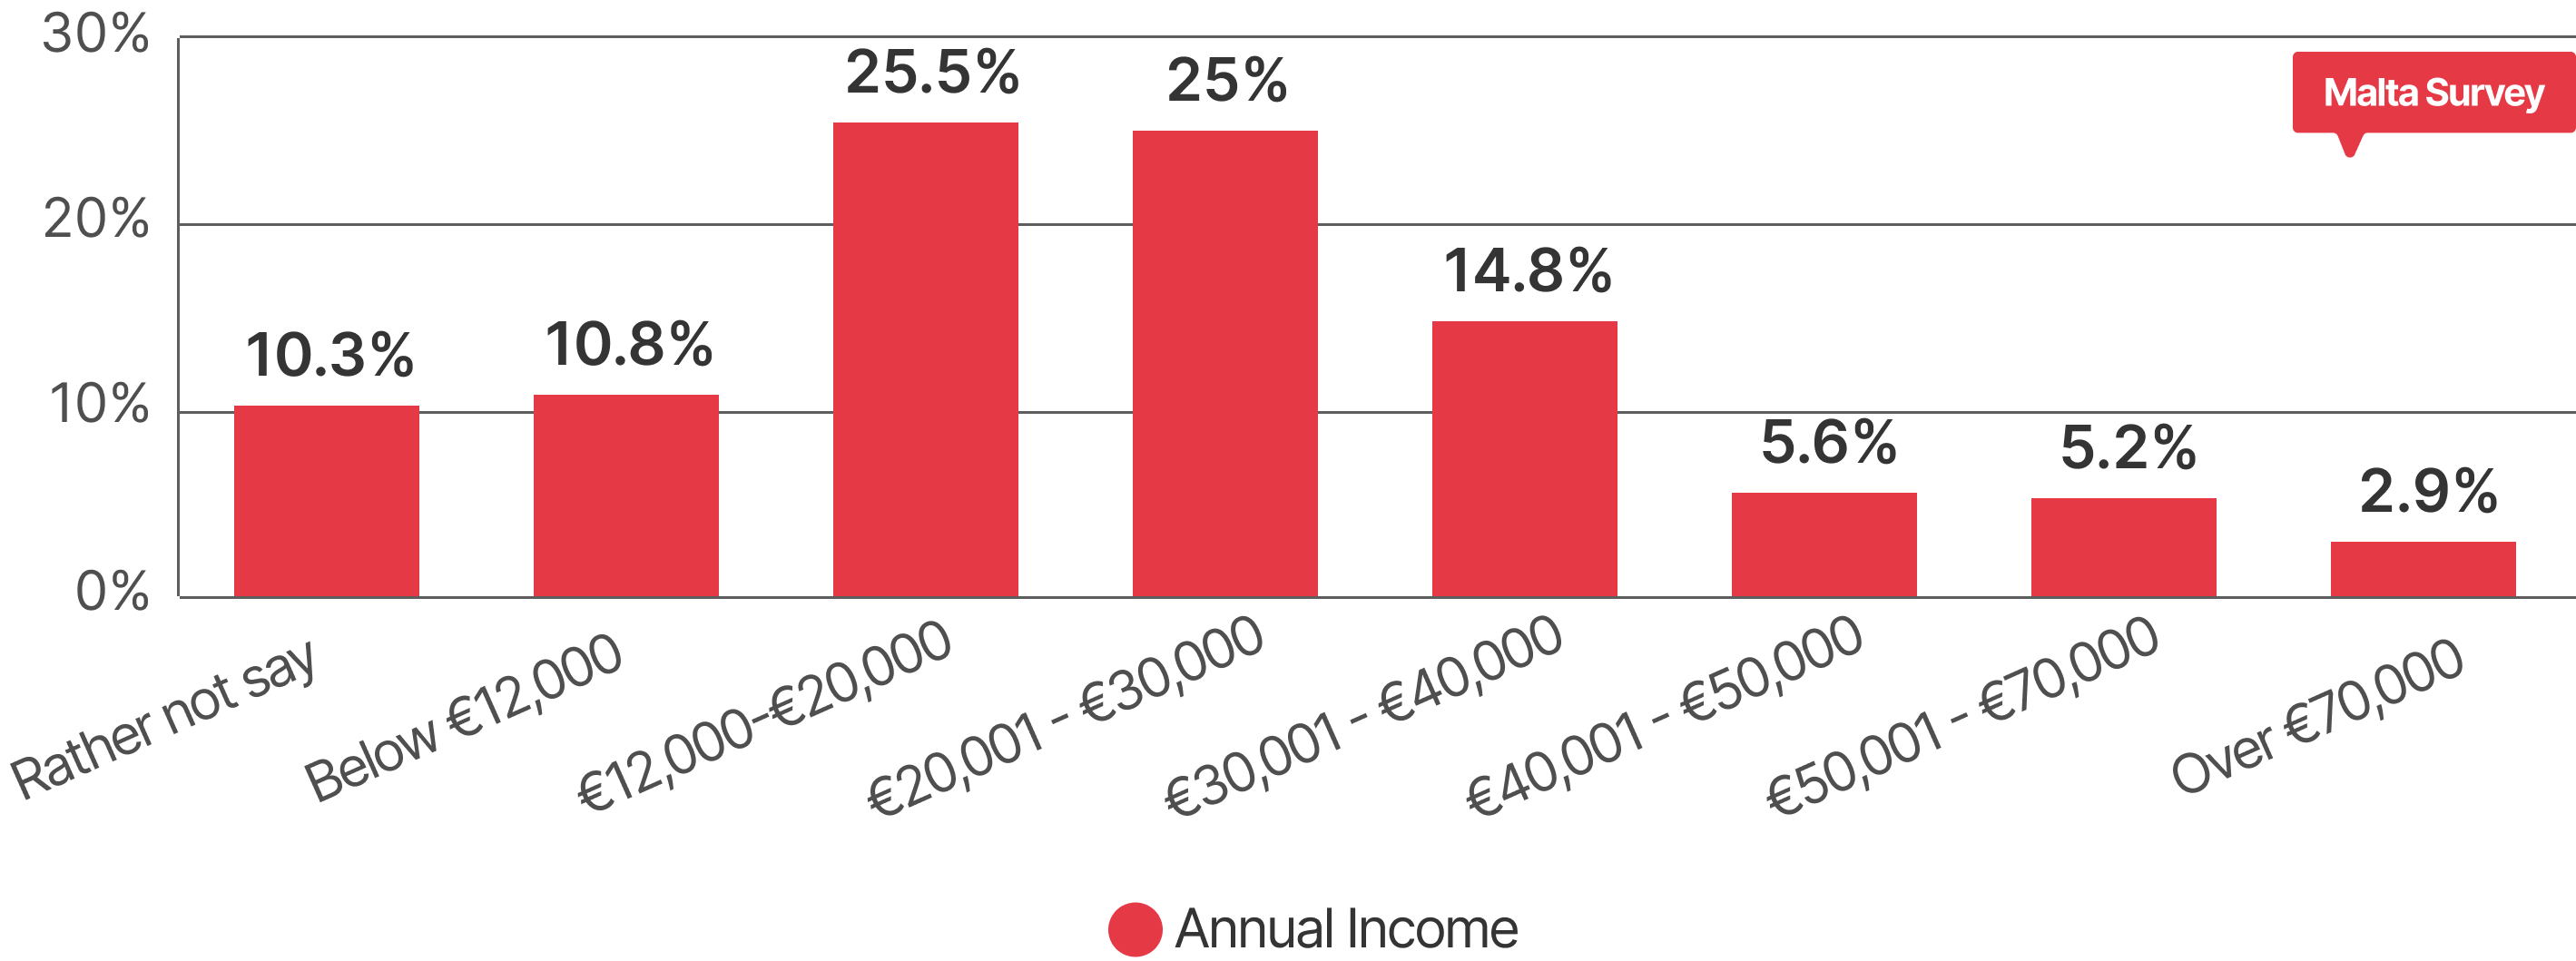
The income distribution of this sample peaks within a range of €12,000 to €30,000 annual income. It's noteworthy that 10.3% of participants felt completely uncomfortable in disclosing their income despite the anonymity of the study, indicating a possible unverified shift in income distribution.
The online survey had the following research questions:
- What are the important priorities that should be placed during the upcoming budget?
- What measures should the government take to reduce the current deficit?
- What economic sectors are to be prioritised during the upcoming budget?
- What is the confidence that this year’s budget will deliver on the expectations of the public?
Findings
Important Measures Expected from Budget 2025
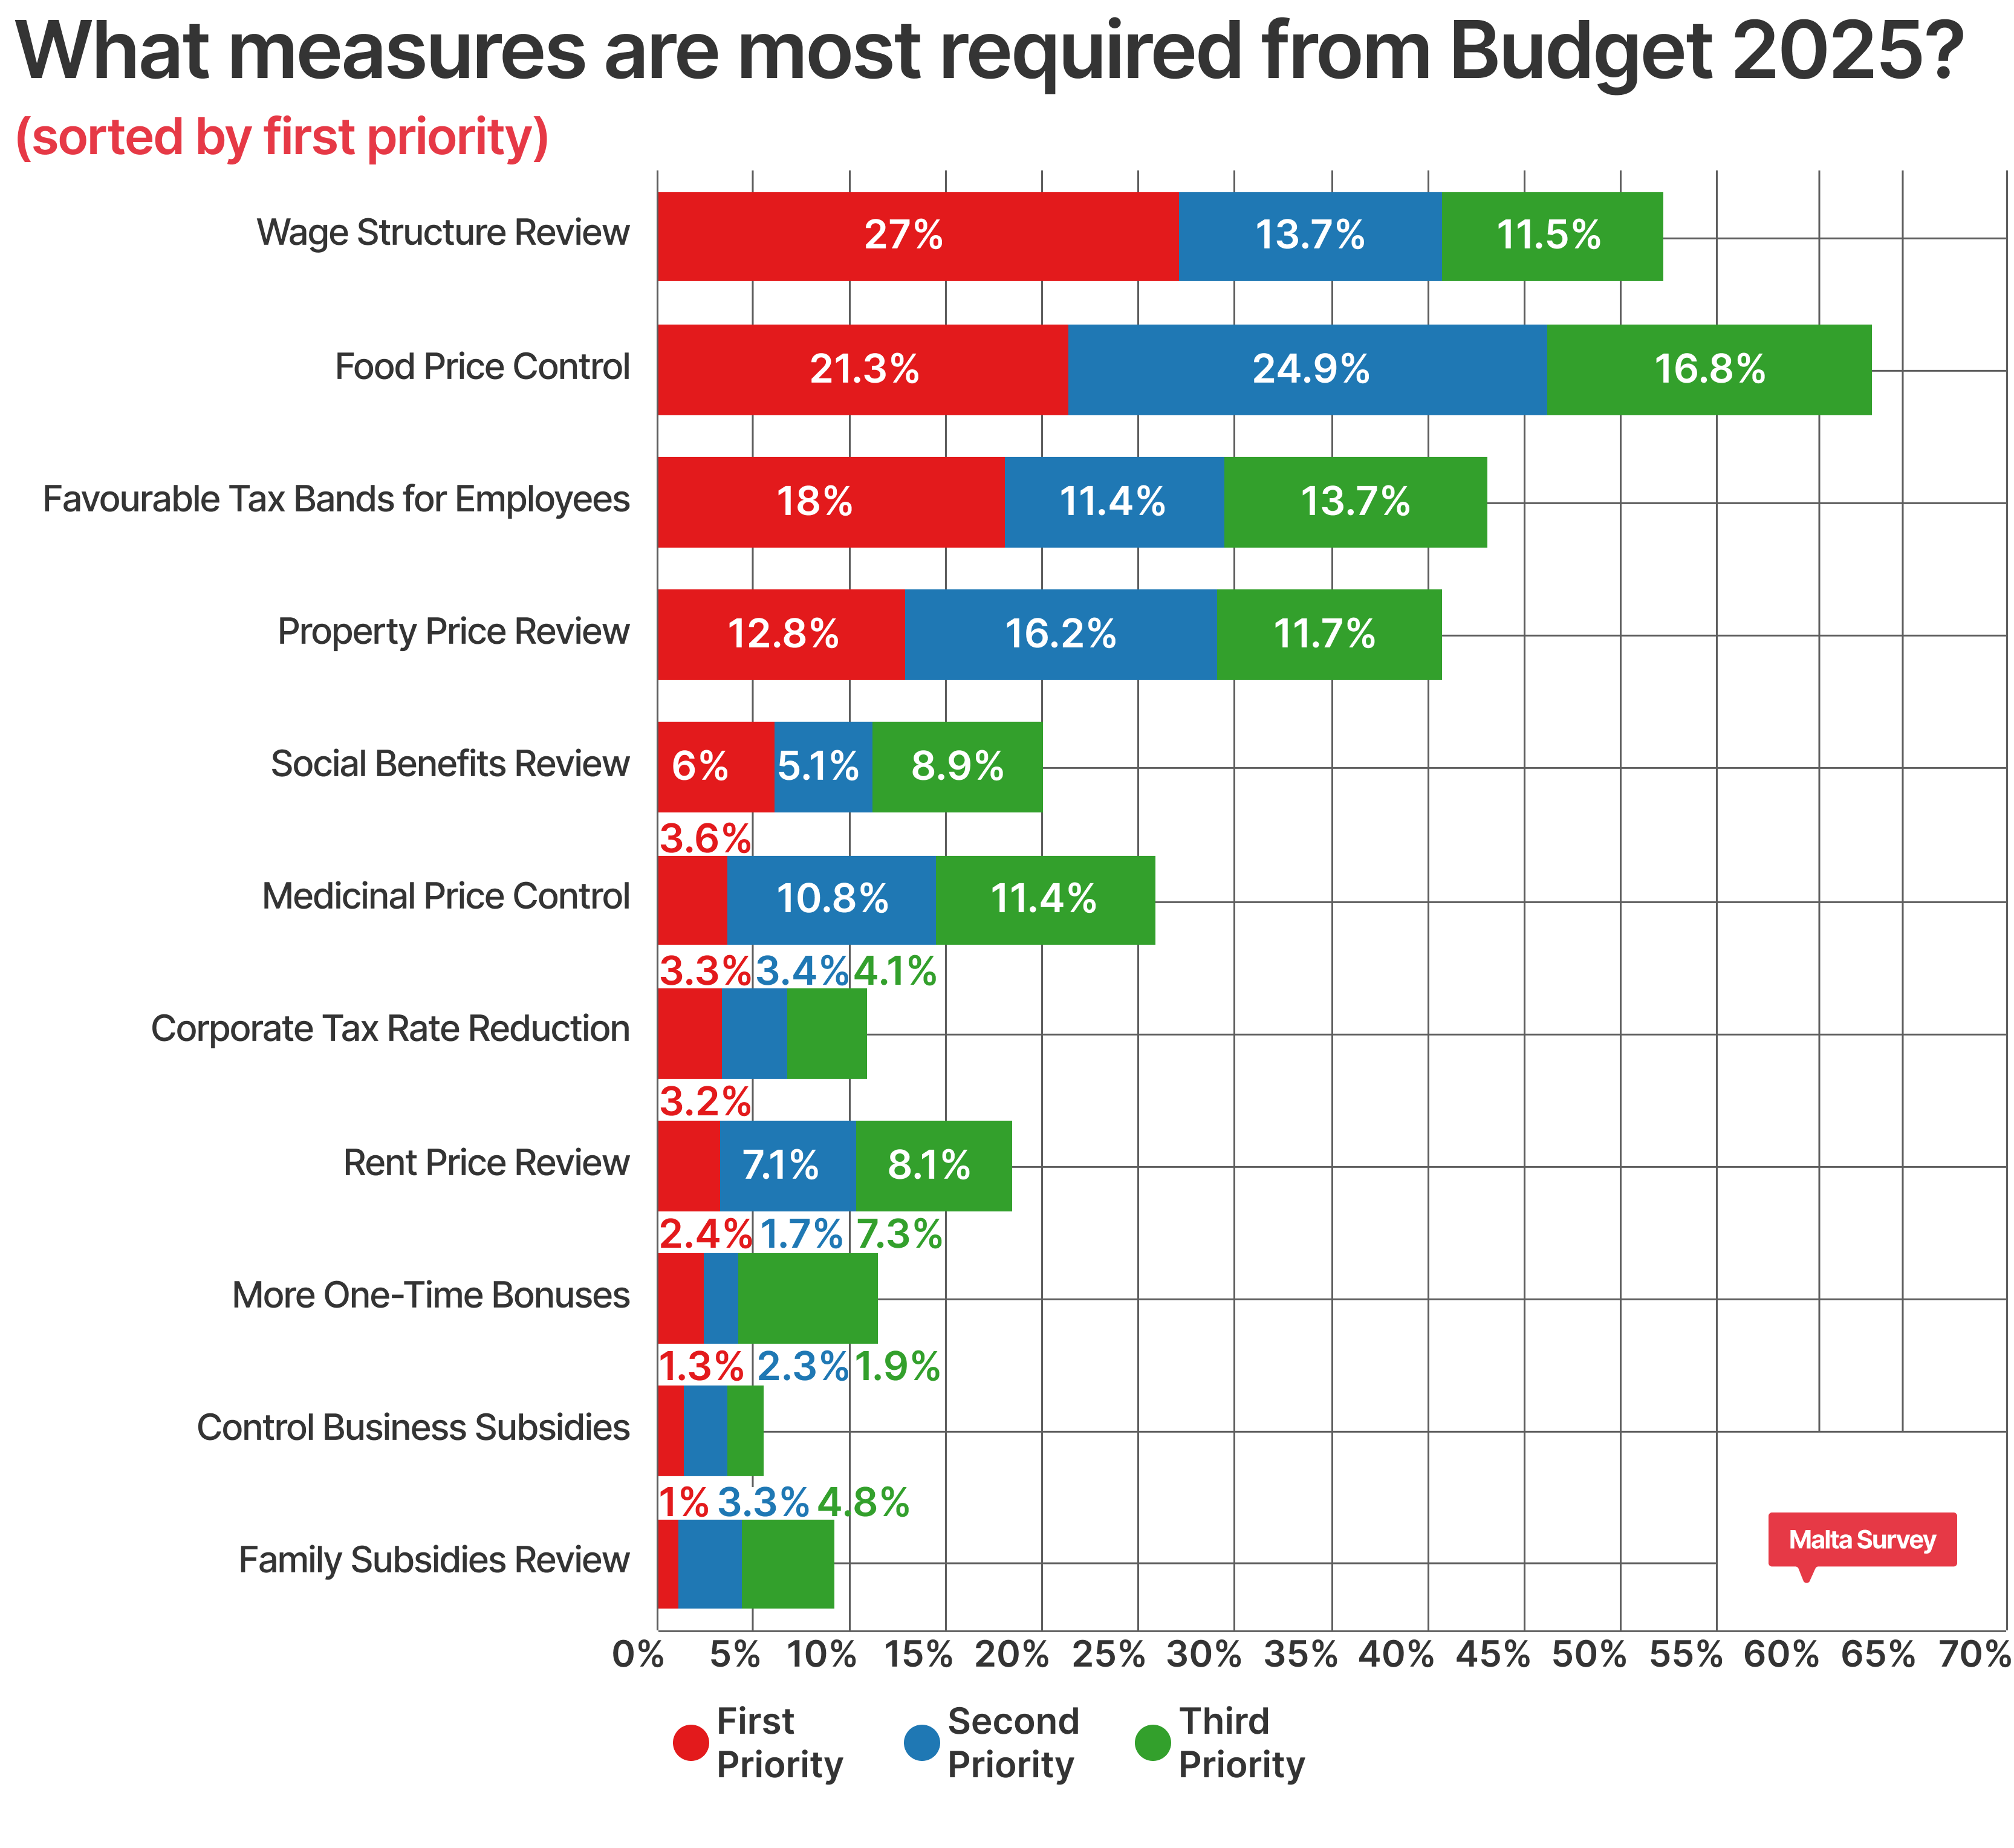
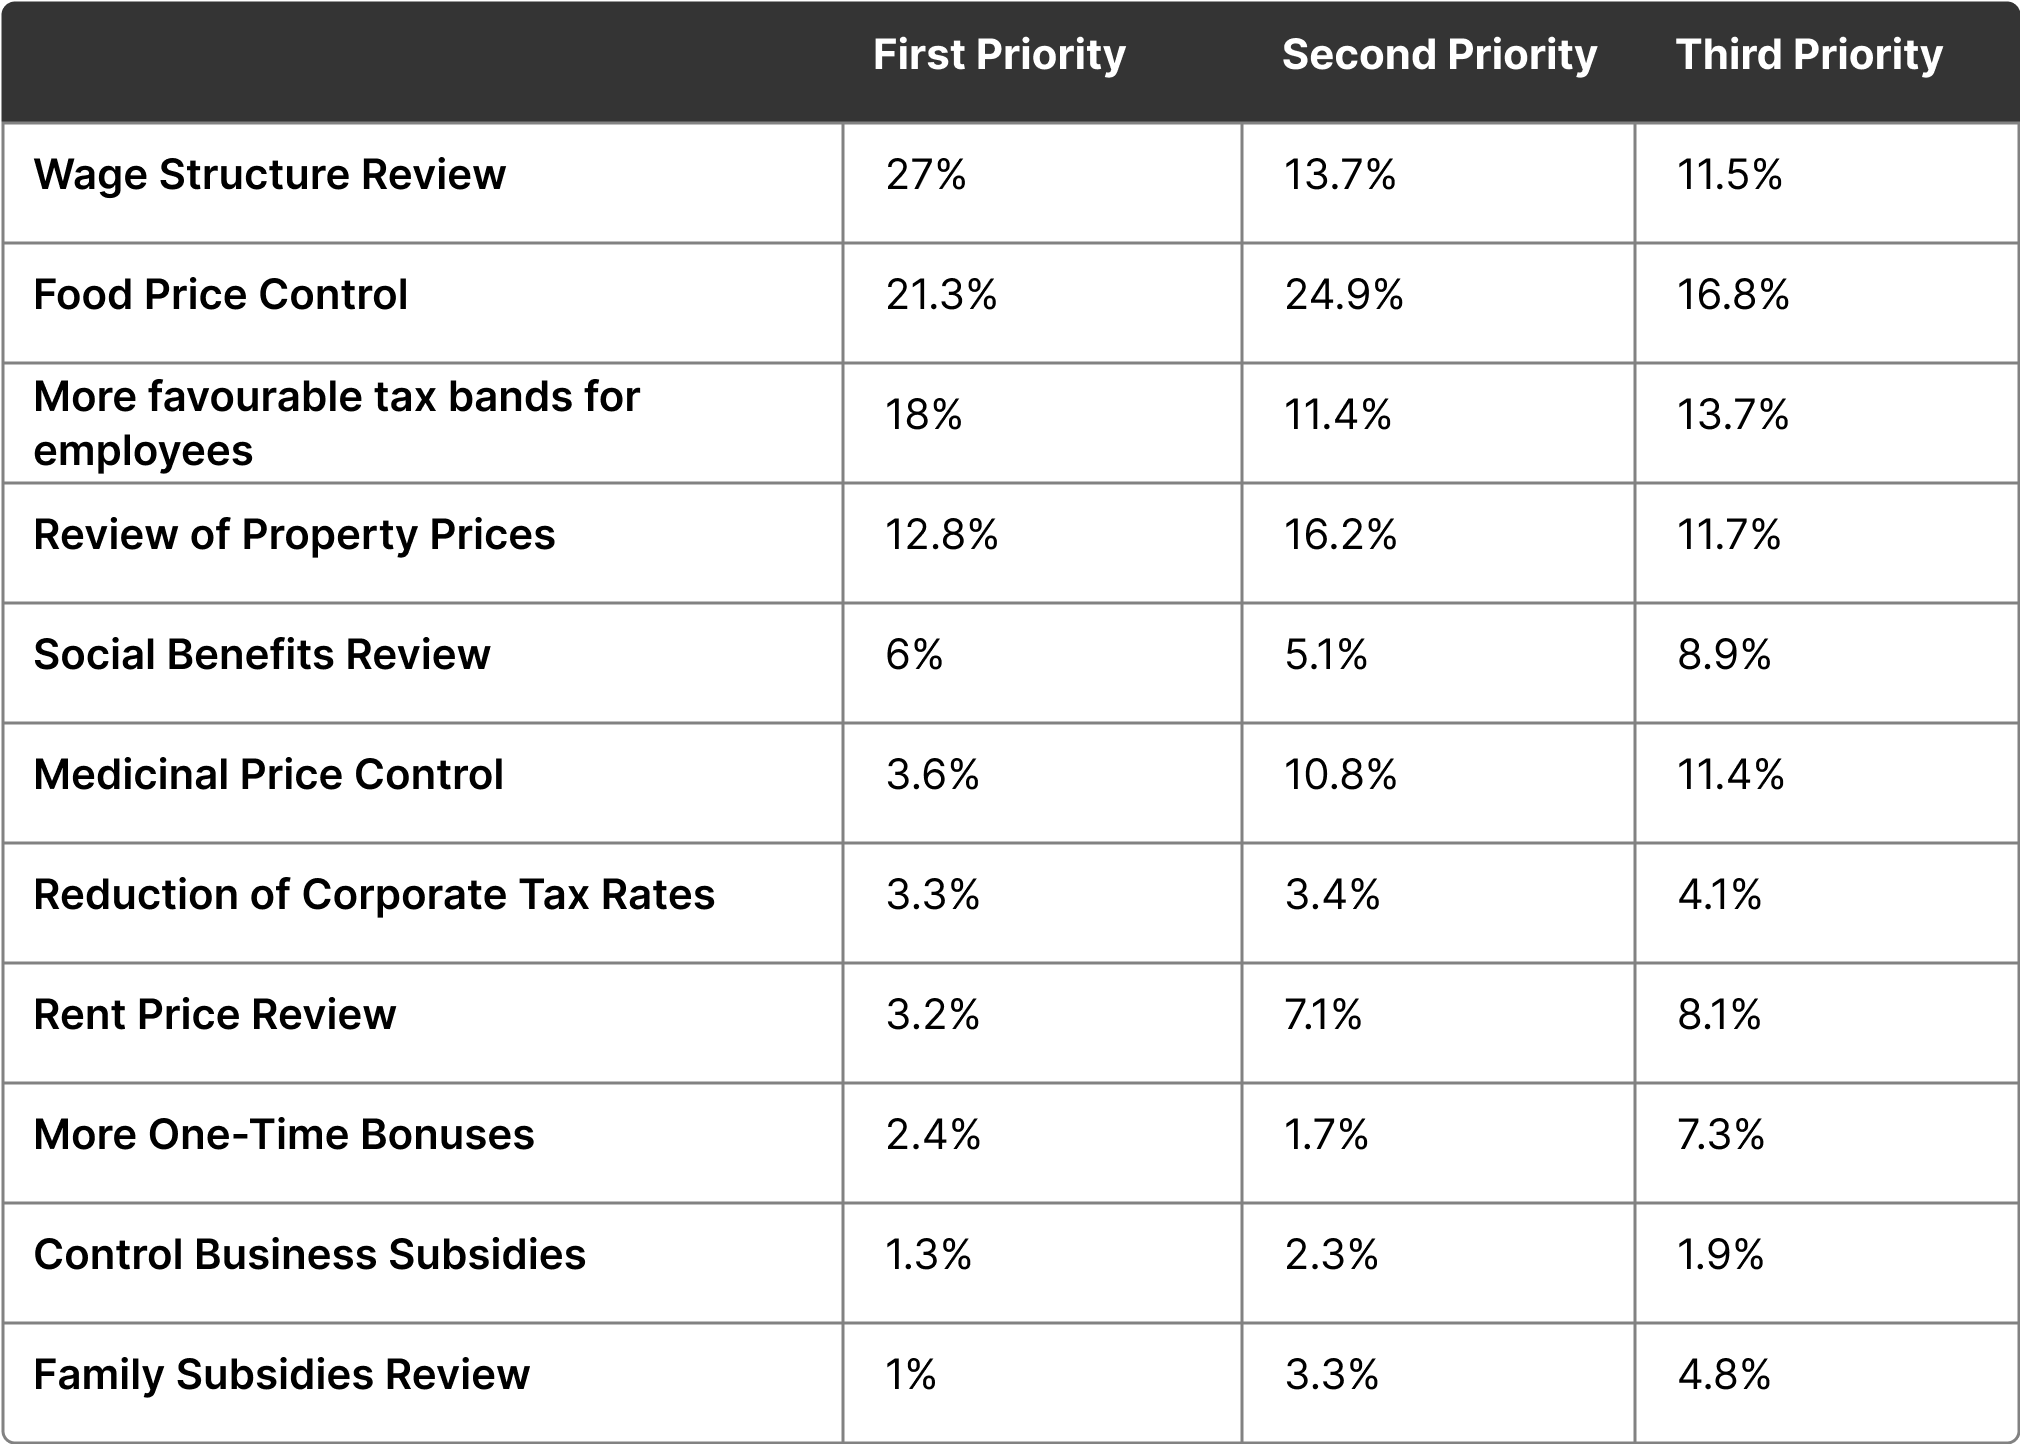
In order to establish relative importance, the participants were given a choice to rank their top three top preferences which they expected to be addressed in Budget 2025. The choices were presented in descending order of priority.
The most popular first priority expressed by this sample was a thorough review of the wage structures currently in place (27%), followed by the need for more stable food prices (21.3%) and more favourable tax bands for employees (18%). This shows how the first priority choices all focus on establishing sustainable methods to keep up with the current costs of living in Malta through basic implementations – wages, food prices and tax bands.
Food price control continued to be a main concern by being the most popular second and third priority (24.9% and 16.8% respectively). Interestingly, the second most popular choice of the second priority saw the sample requesting a thorough review of the current property prices (16.2%). Coupled with the aforementioned concerns raised for the first priorities to establish a standard of living in a sustainable manner, a review of the current prices of properties in Malta support this claim – as a property is the most long-term asset one can buy. This review of property prices is also the third most popular choice for the third priority (11.7%).
Even though the wage structure review occupies the highest first priority allocation, the overall total of priority allocations is highest amongst the necessity of the food prices to be controlled. This is a consistent result with last year’s survey which saw food price control also getting the highest total allocation of requirement (including the highest first priority portion).
On a more practical level, the first three preferences show that the majority of respondents are more concerned with “bread and butter” issues, putting their standard of living prospects top on the agenda.This outcome further reinforces the general idea that ultimately people measure their well-being through monetary value. In fact, if one had to realise the importance of these three attributes, one would conclude that these lead to more disposable income.
Supported suggestions to control the current government deficit
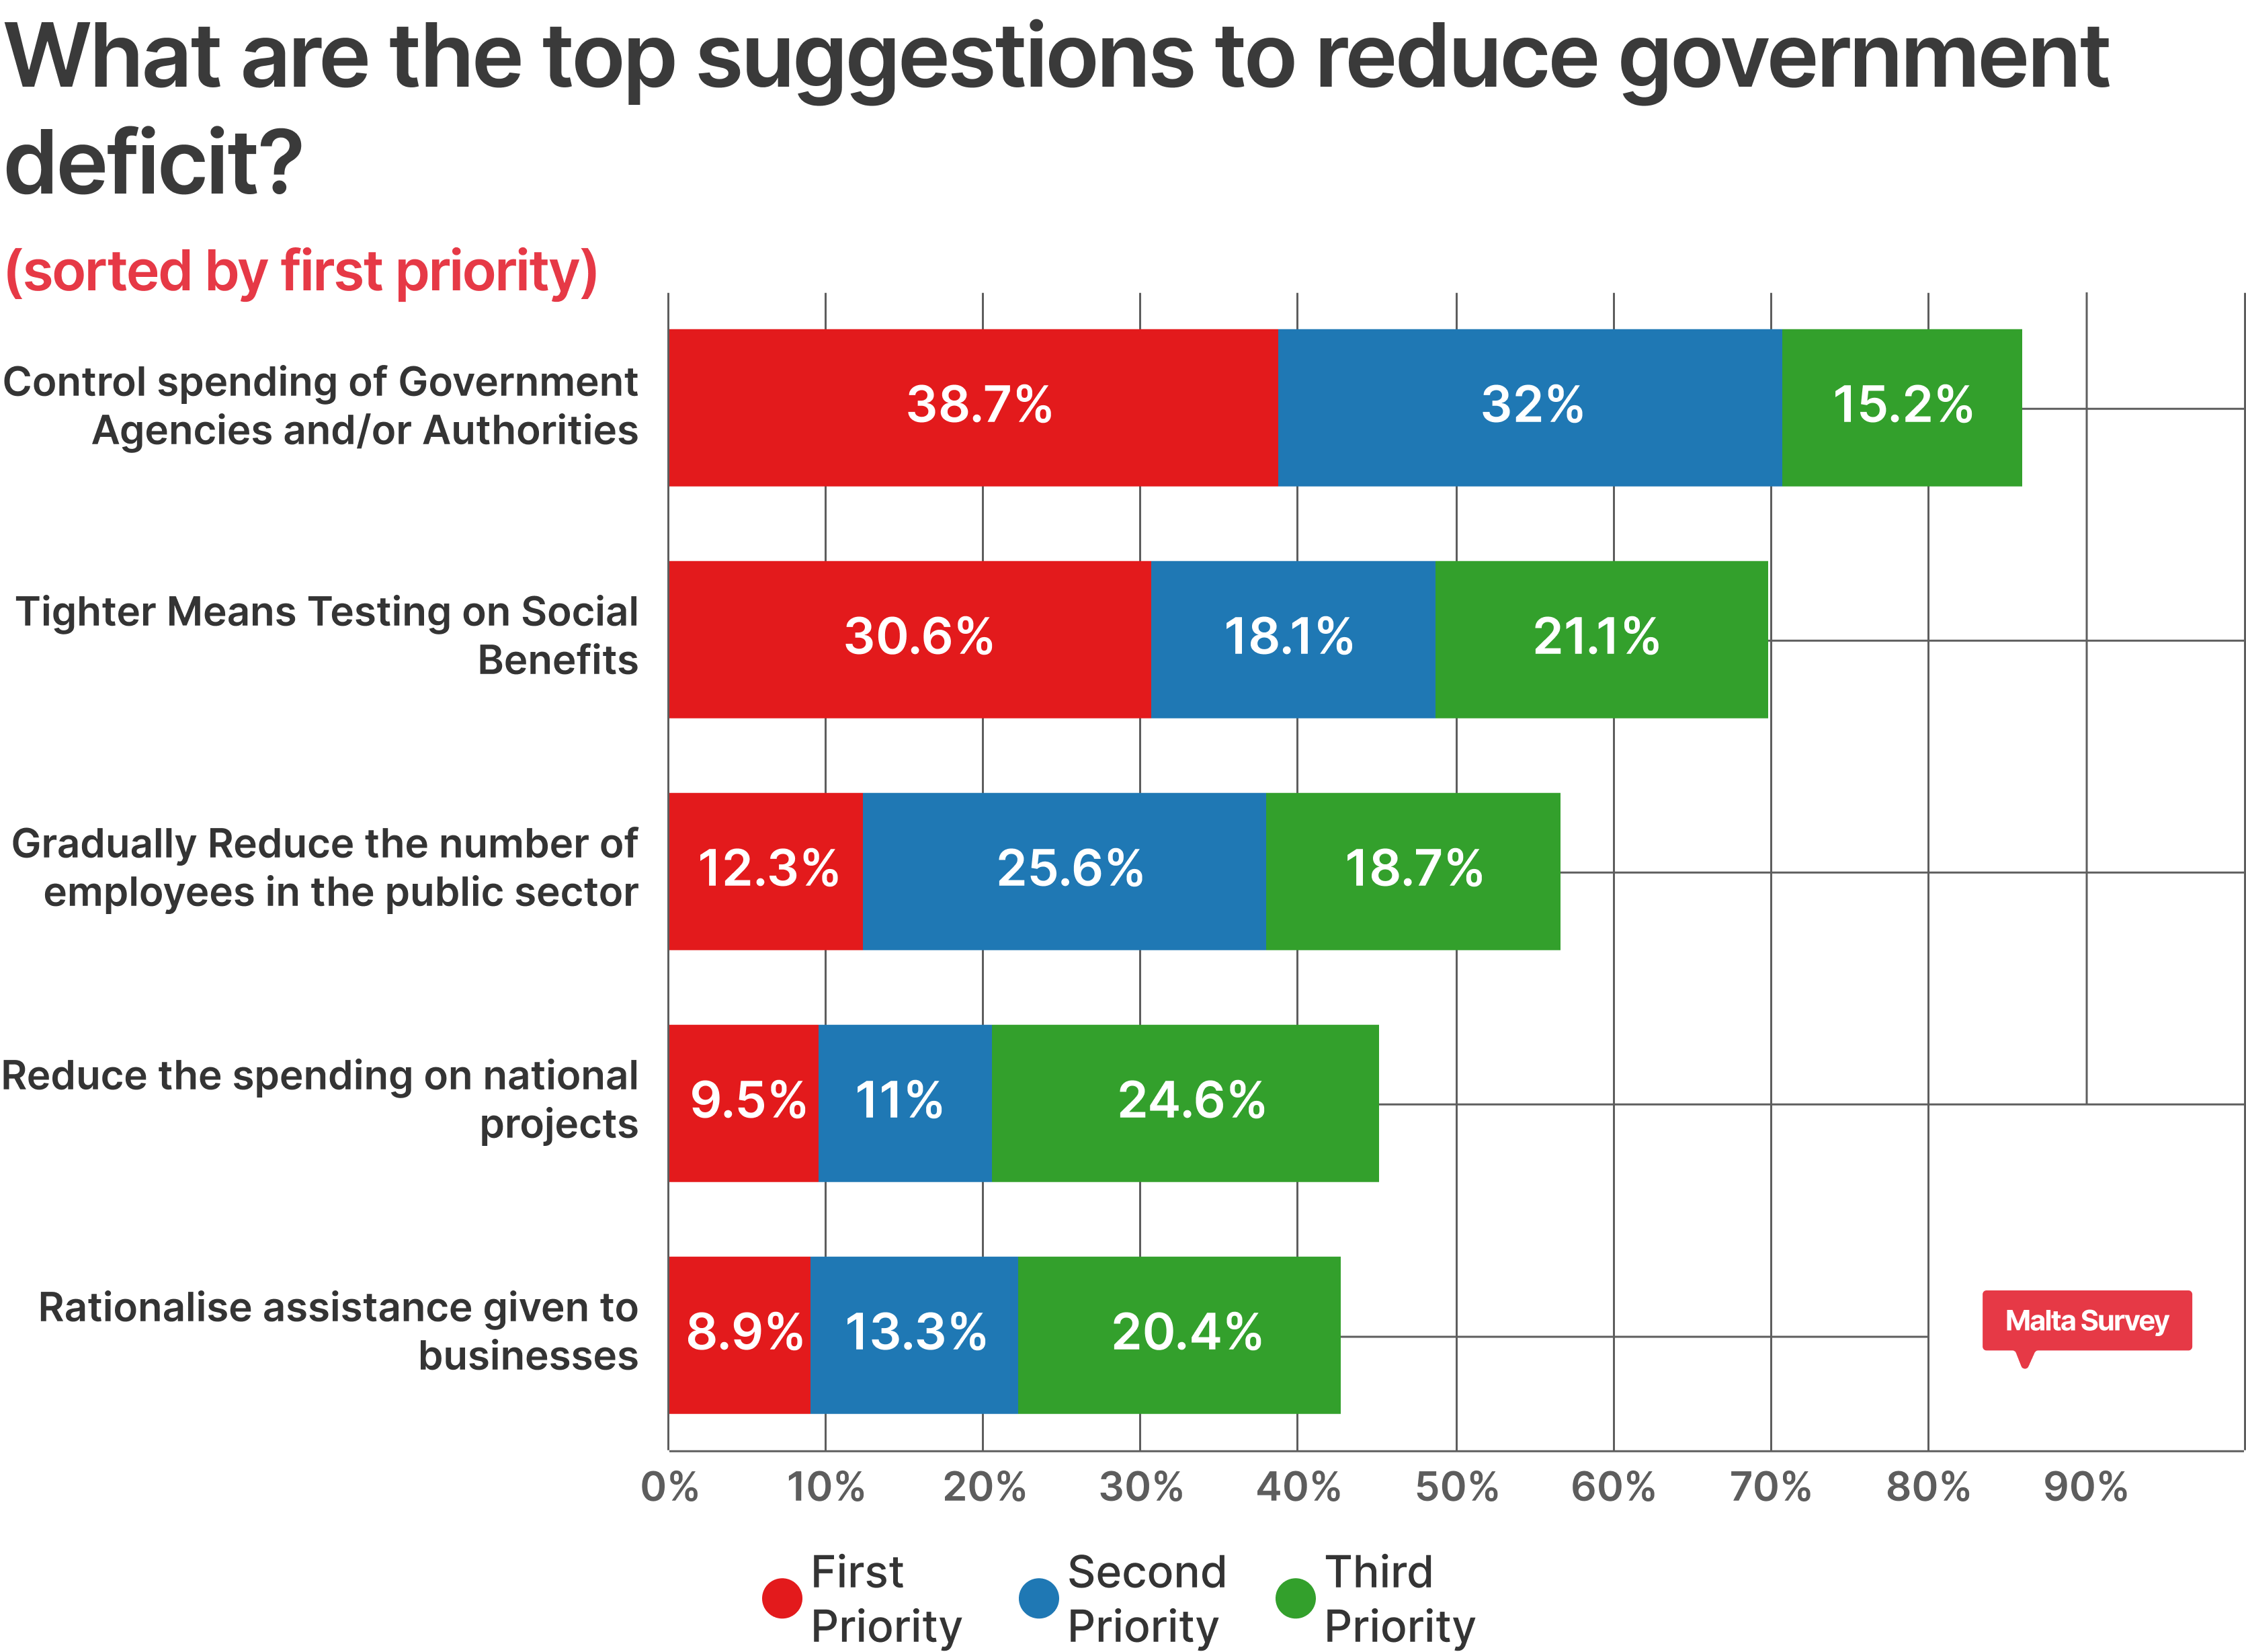
Based on our sample, the most common suggestion aimed towards reducing the government deficit is for the government itself to control its spending on its agencies and/or authorities. This immediately beckons the idea, that in general people still perceive that most Government agencies and authorities could be run more effectively and efficiently. Conversely, the result may also suggest that authorities and government agencies should be held more accountable for their spending. This suggestion had the highest first priority (39%) and second priority (32%) portion.
The second most sought-after request for deficit control involves the use of tighter means testing to control the amount of funds being issued through social benefit schemes. With a total of 30.6% of the respondents opting for it as a first priority (and a further 18% of the second priority and 21% of the third priority), this result raises concern that while in general difference successive Governments have ensured that the social services remain a top priority in their policy-making, the general public may feel that in some cases these could be abused. One is not surprised by these results, considering that this topic has been on the national agenda for weeks. It is important to note that this measure does not treat the removal of any services offered by the nation’s social security, but rather the testing mechanism by which someone is granted benefits to become stricter.
These two measures are further complimented by the third most popular choice, being a gradual reduction of the number of employees in the public sector, with 12.3% of the sample allocating it as a first priority, 25.6% as a second priority, and 18.7% as a third priority. Once again, the general idea that the public service and public sector could be over the required complement, has been on the agenda for the last three years since we have been carrying out this pre-budget study.
Economic sectors that most require emphasis from Budget 2025
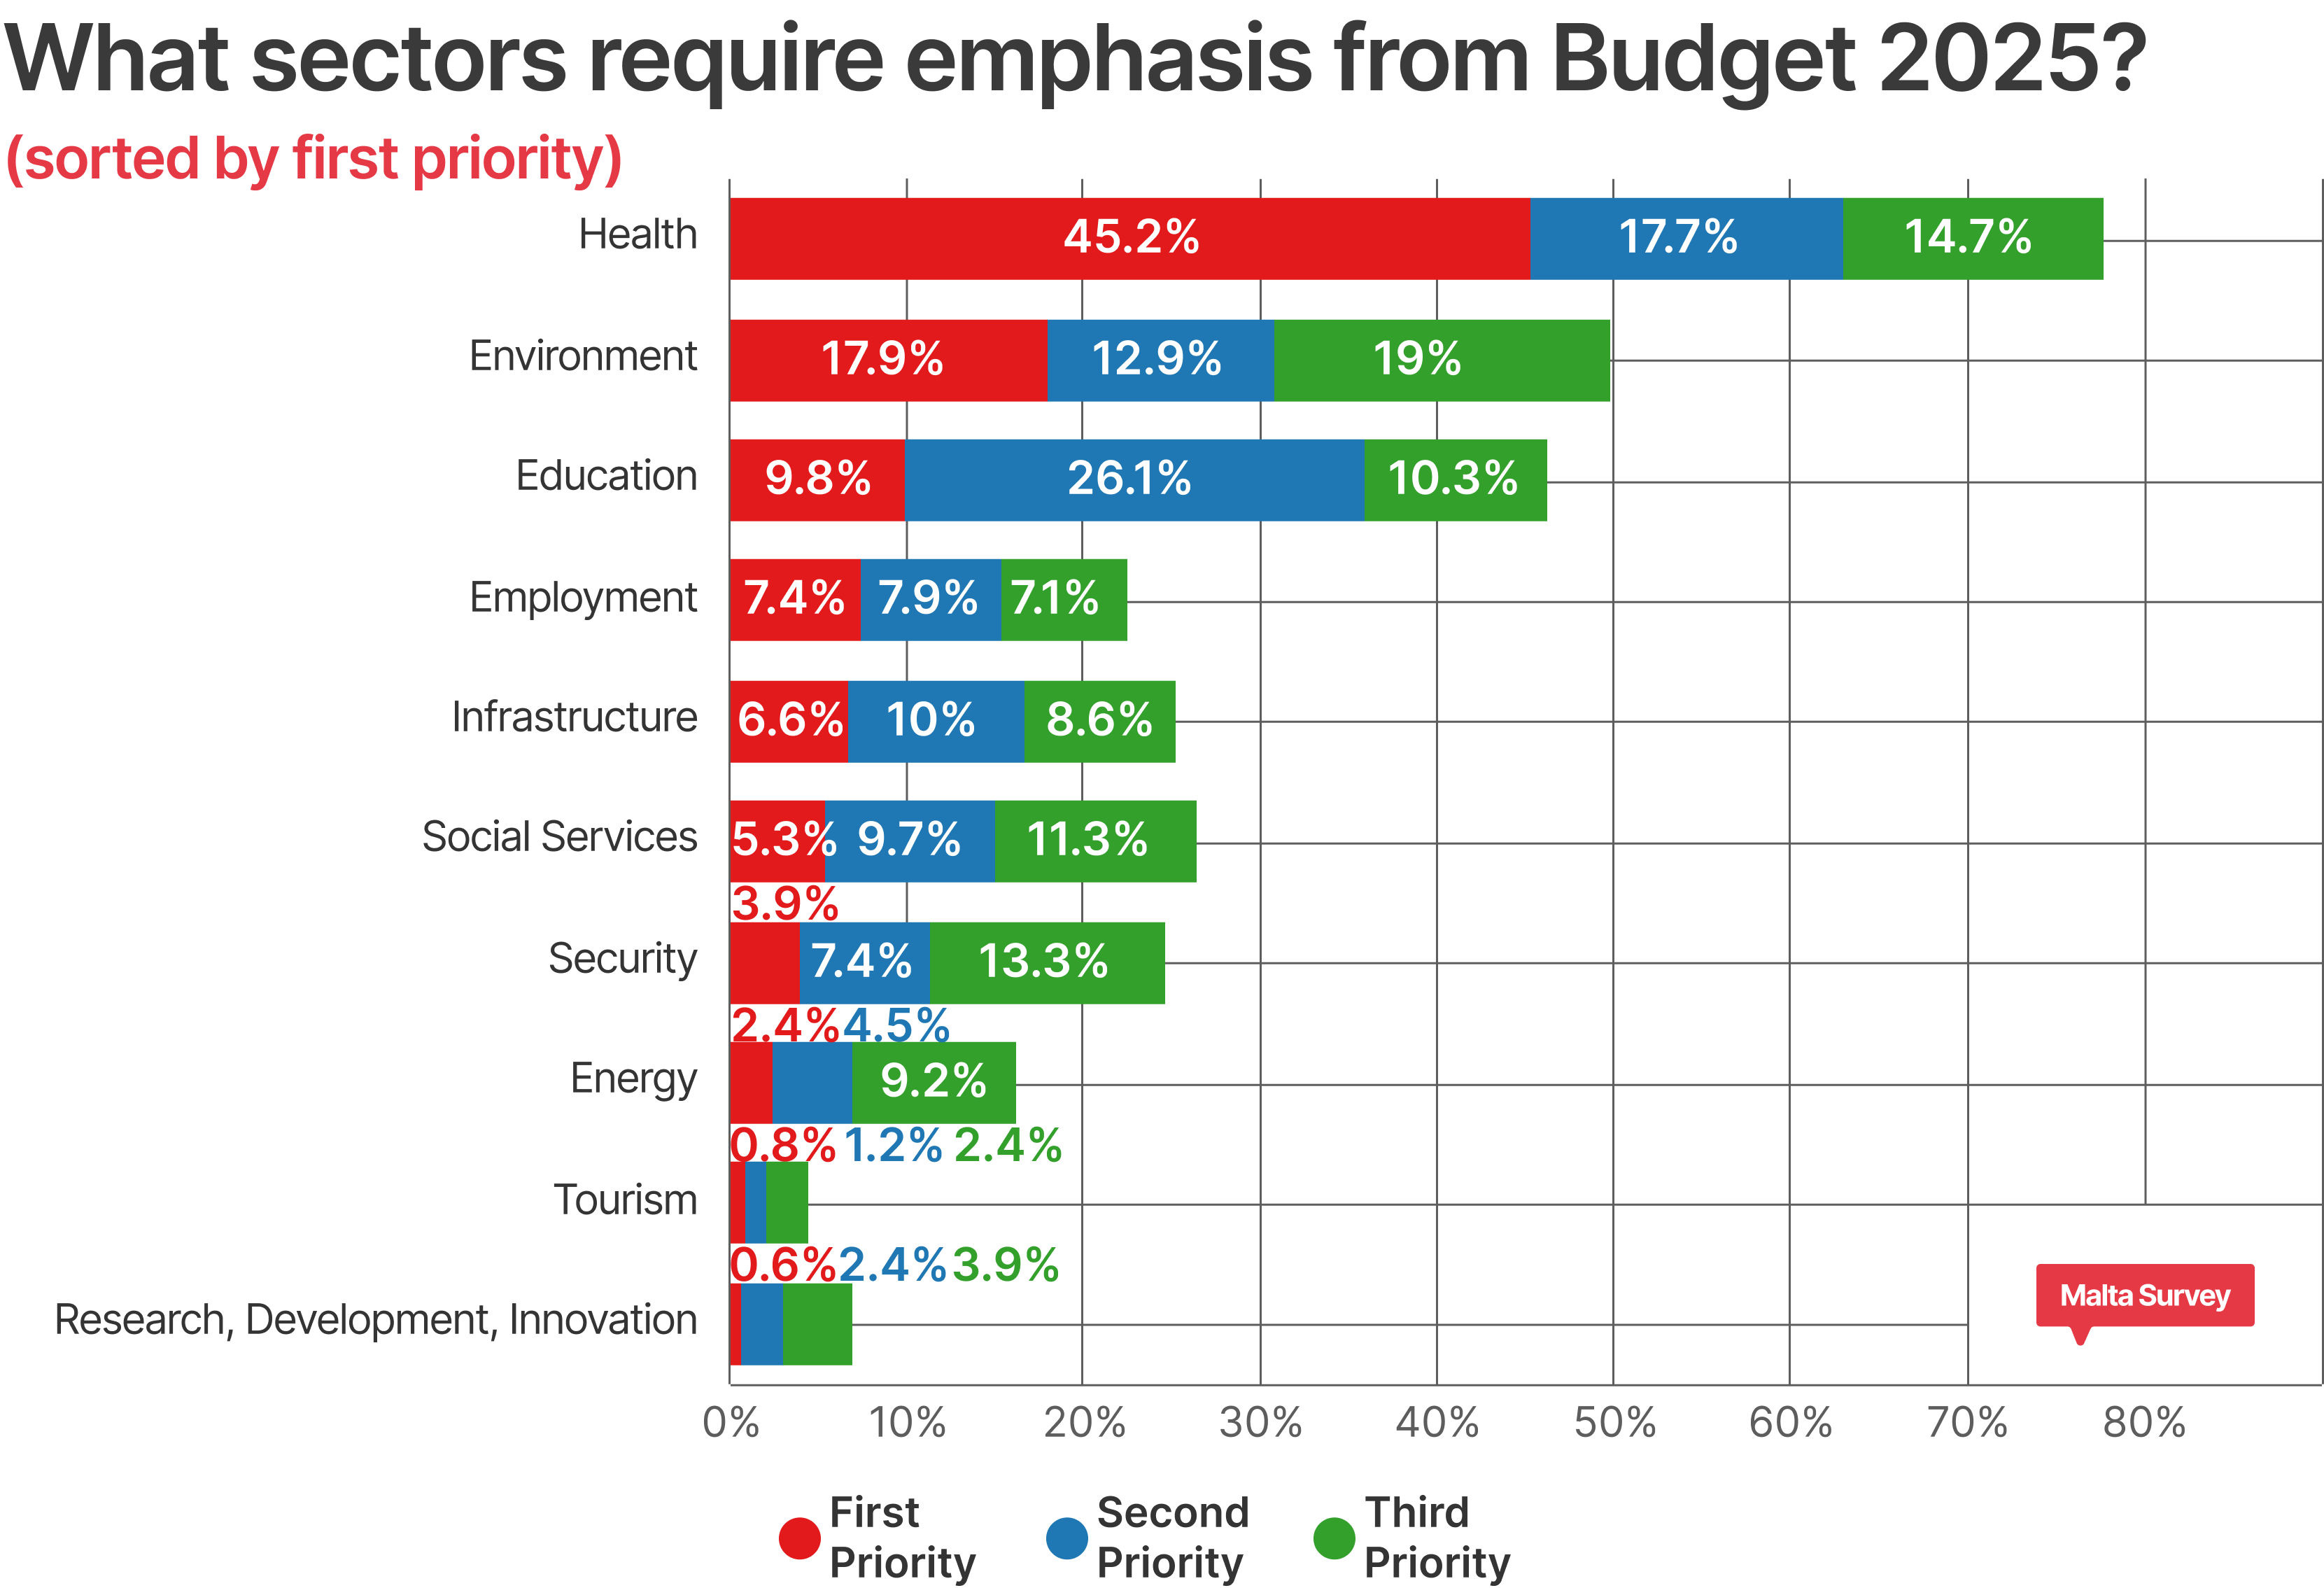
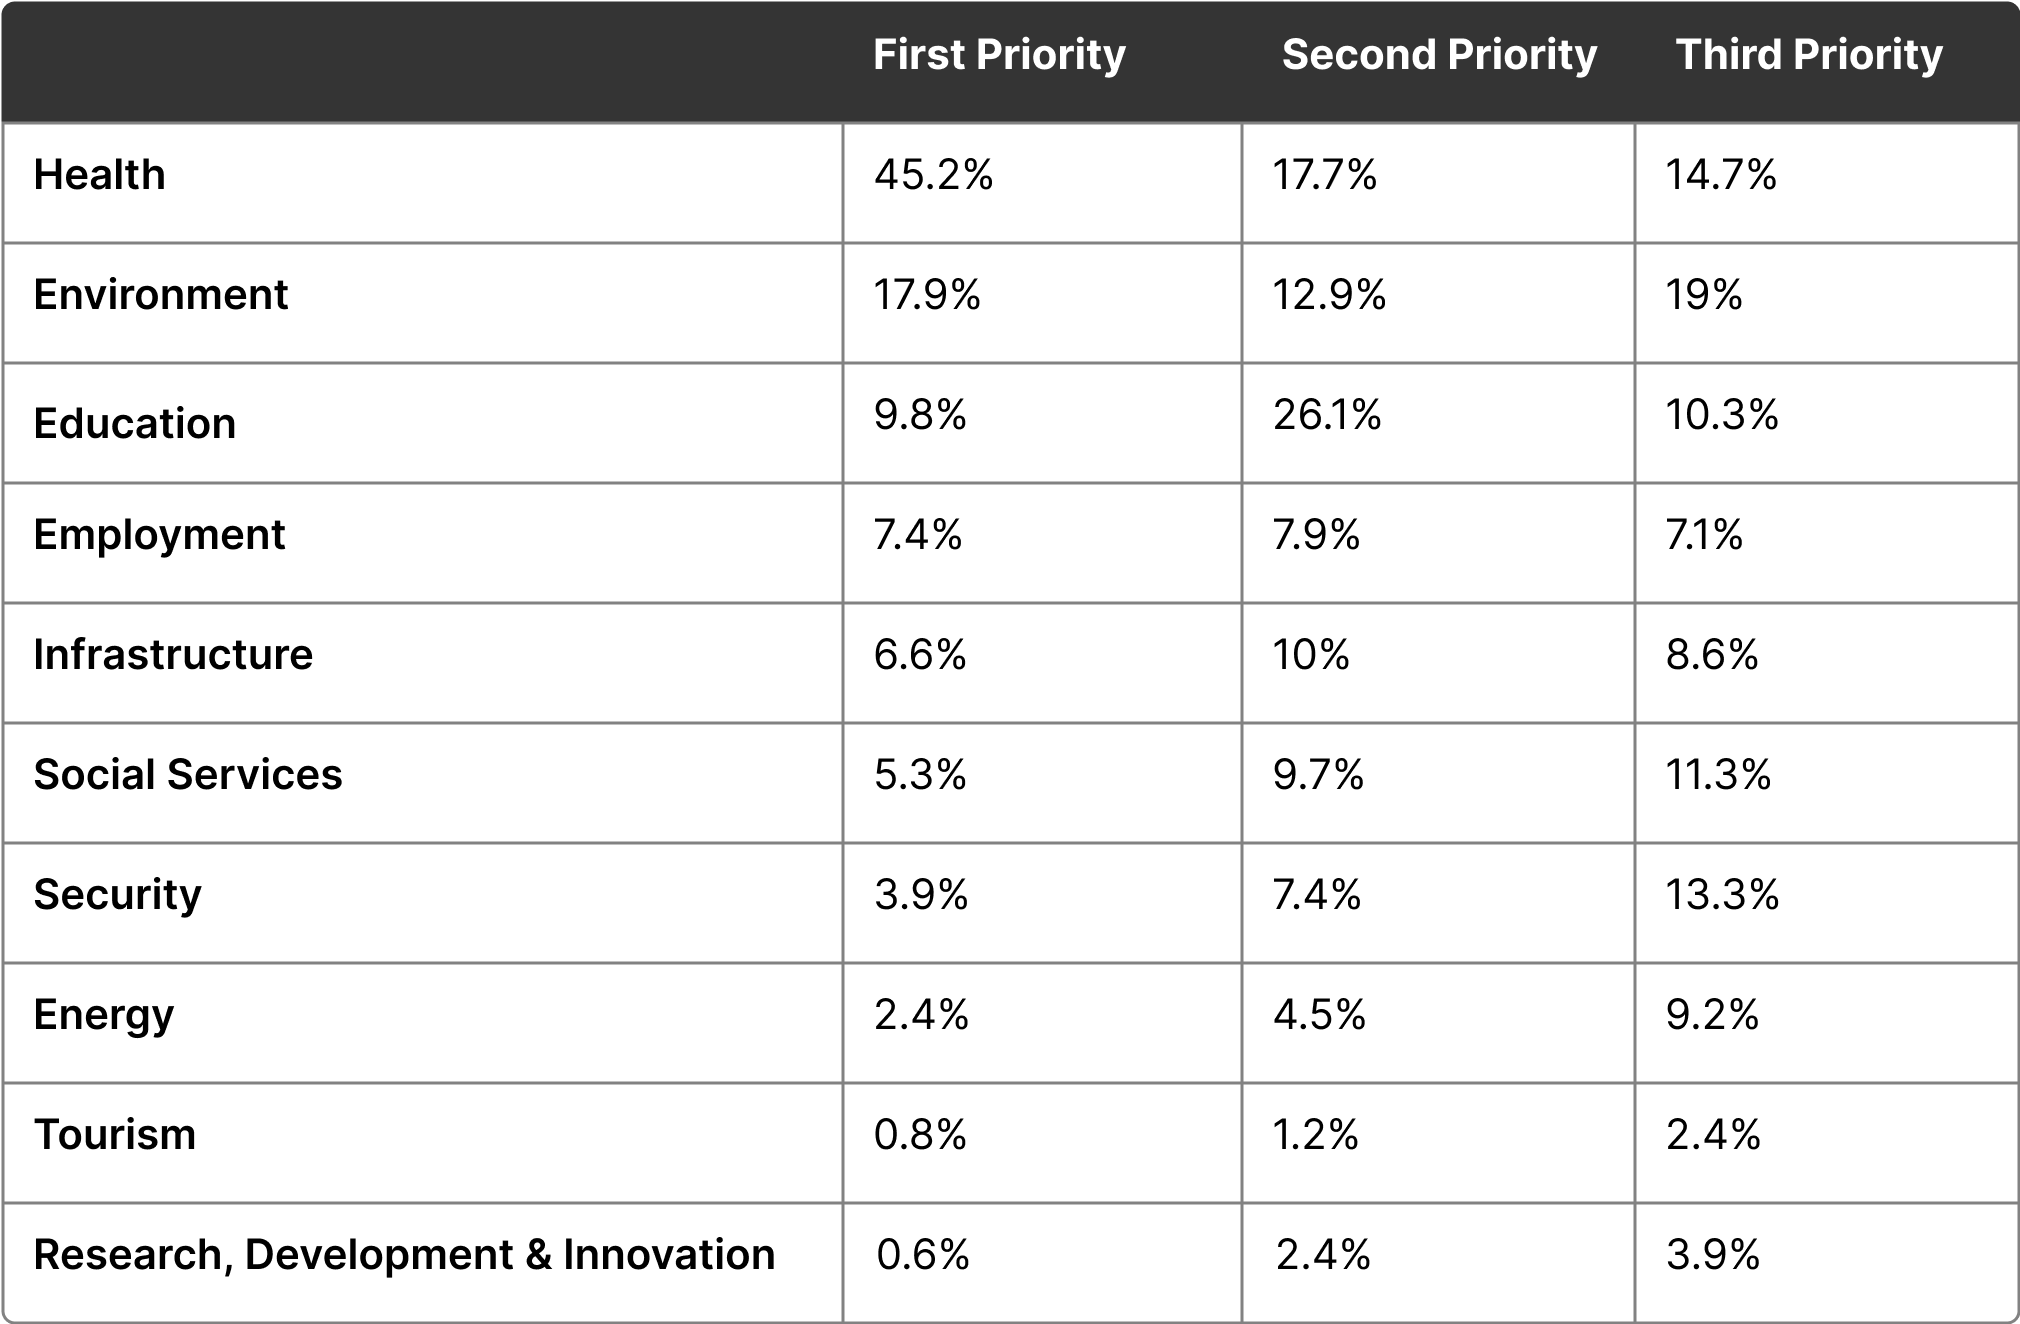
The final category of prioritising asked of the participants during the online survey was their top three ranked sectors which they consider most necessary for funding emphasis from Budget 2025.
Similar to last year’s Budget perception survey, the top three sectors requiring emphasis based on the responses from our sample were Health, Environment, and Education. A total of 45.2% of the sample placed the health sector as their first priority (an 8.9% increase from last year), 17.7% placed it as their second priority and 15% placed it as their third priority. The environment increased in the first priority portion from last year by 1.4% as just under 18% of the sample placed it as their first priority. Whilst the education sector decreased in the first priority portion by 3.1%, with just under 10% of the sample placing it as their first priority, it increased in the second priority by 2.6% as 26.1% of the sample placed it as their second priority.
The first three options of the study probably reveal the general feeling of the Maltese population. In the three years that this pre-budget survey has been running, Health, Education, and the Environment have always been the top three sectors, with differentiating orders over the years. Mirroring Maslow’s hierarchy of needs, it is expected that with a constant improvement in the standard of living, respondents also feel that the next important attribute for a better life is having a good environment to live in.
The bottom three sectors in terms of emphasis required by the Budget were the same sectors mentioned in last year’s survey. Energy remained as the third least required sector, tourism is now the second least required sector and research & development is now the least required sector. At this point, it is important to note that this survey exhibits its results at a 3.3% margin of error.
Budget 2025's Expectations Sentiment
After assessing participants’ priorities concerning fiscal policies, deficit management and key national sectors, this final section of the survey explored respondents’ views on whether they felt the measures that will be presented in Budget 2025 would adequately address their identified needs. Responses were gathered using a basic 5-point scale, ranging from “Highly Confident” to “Not at all Confident”
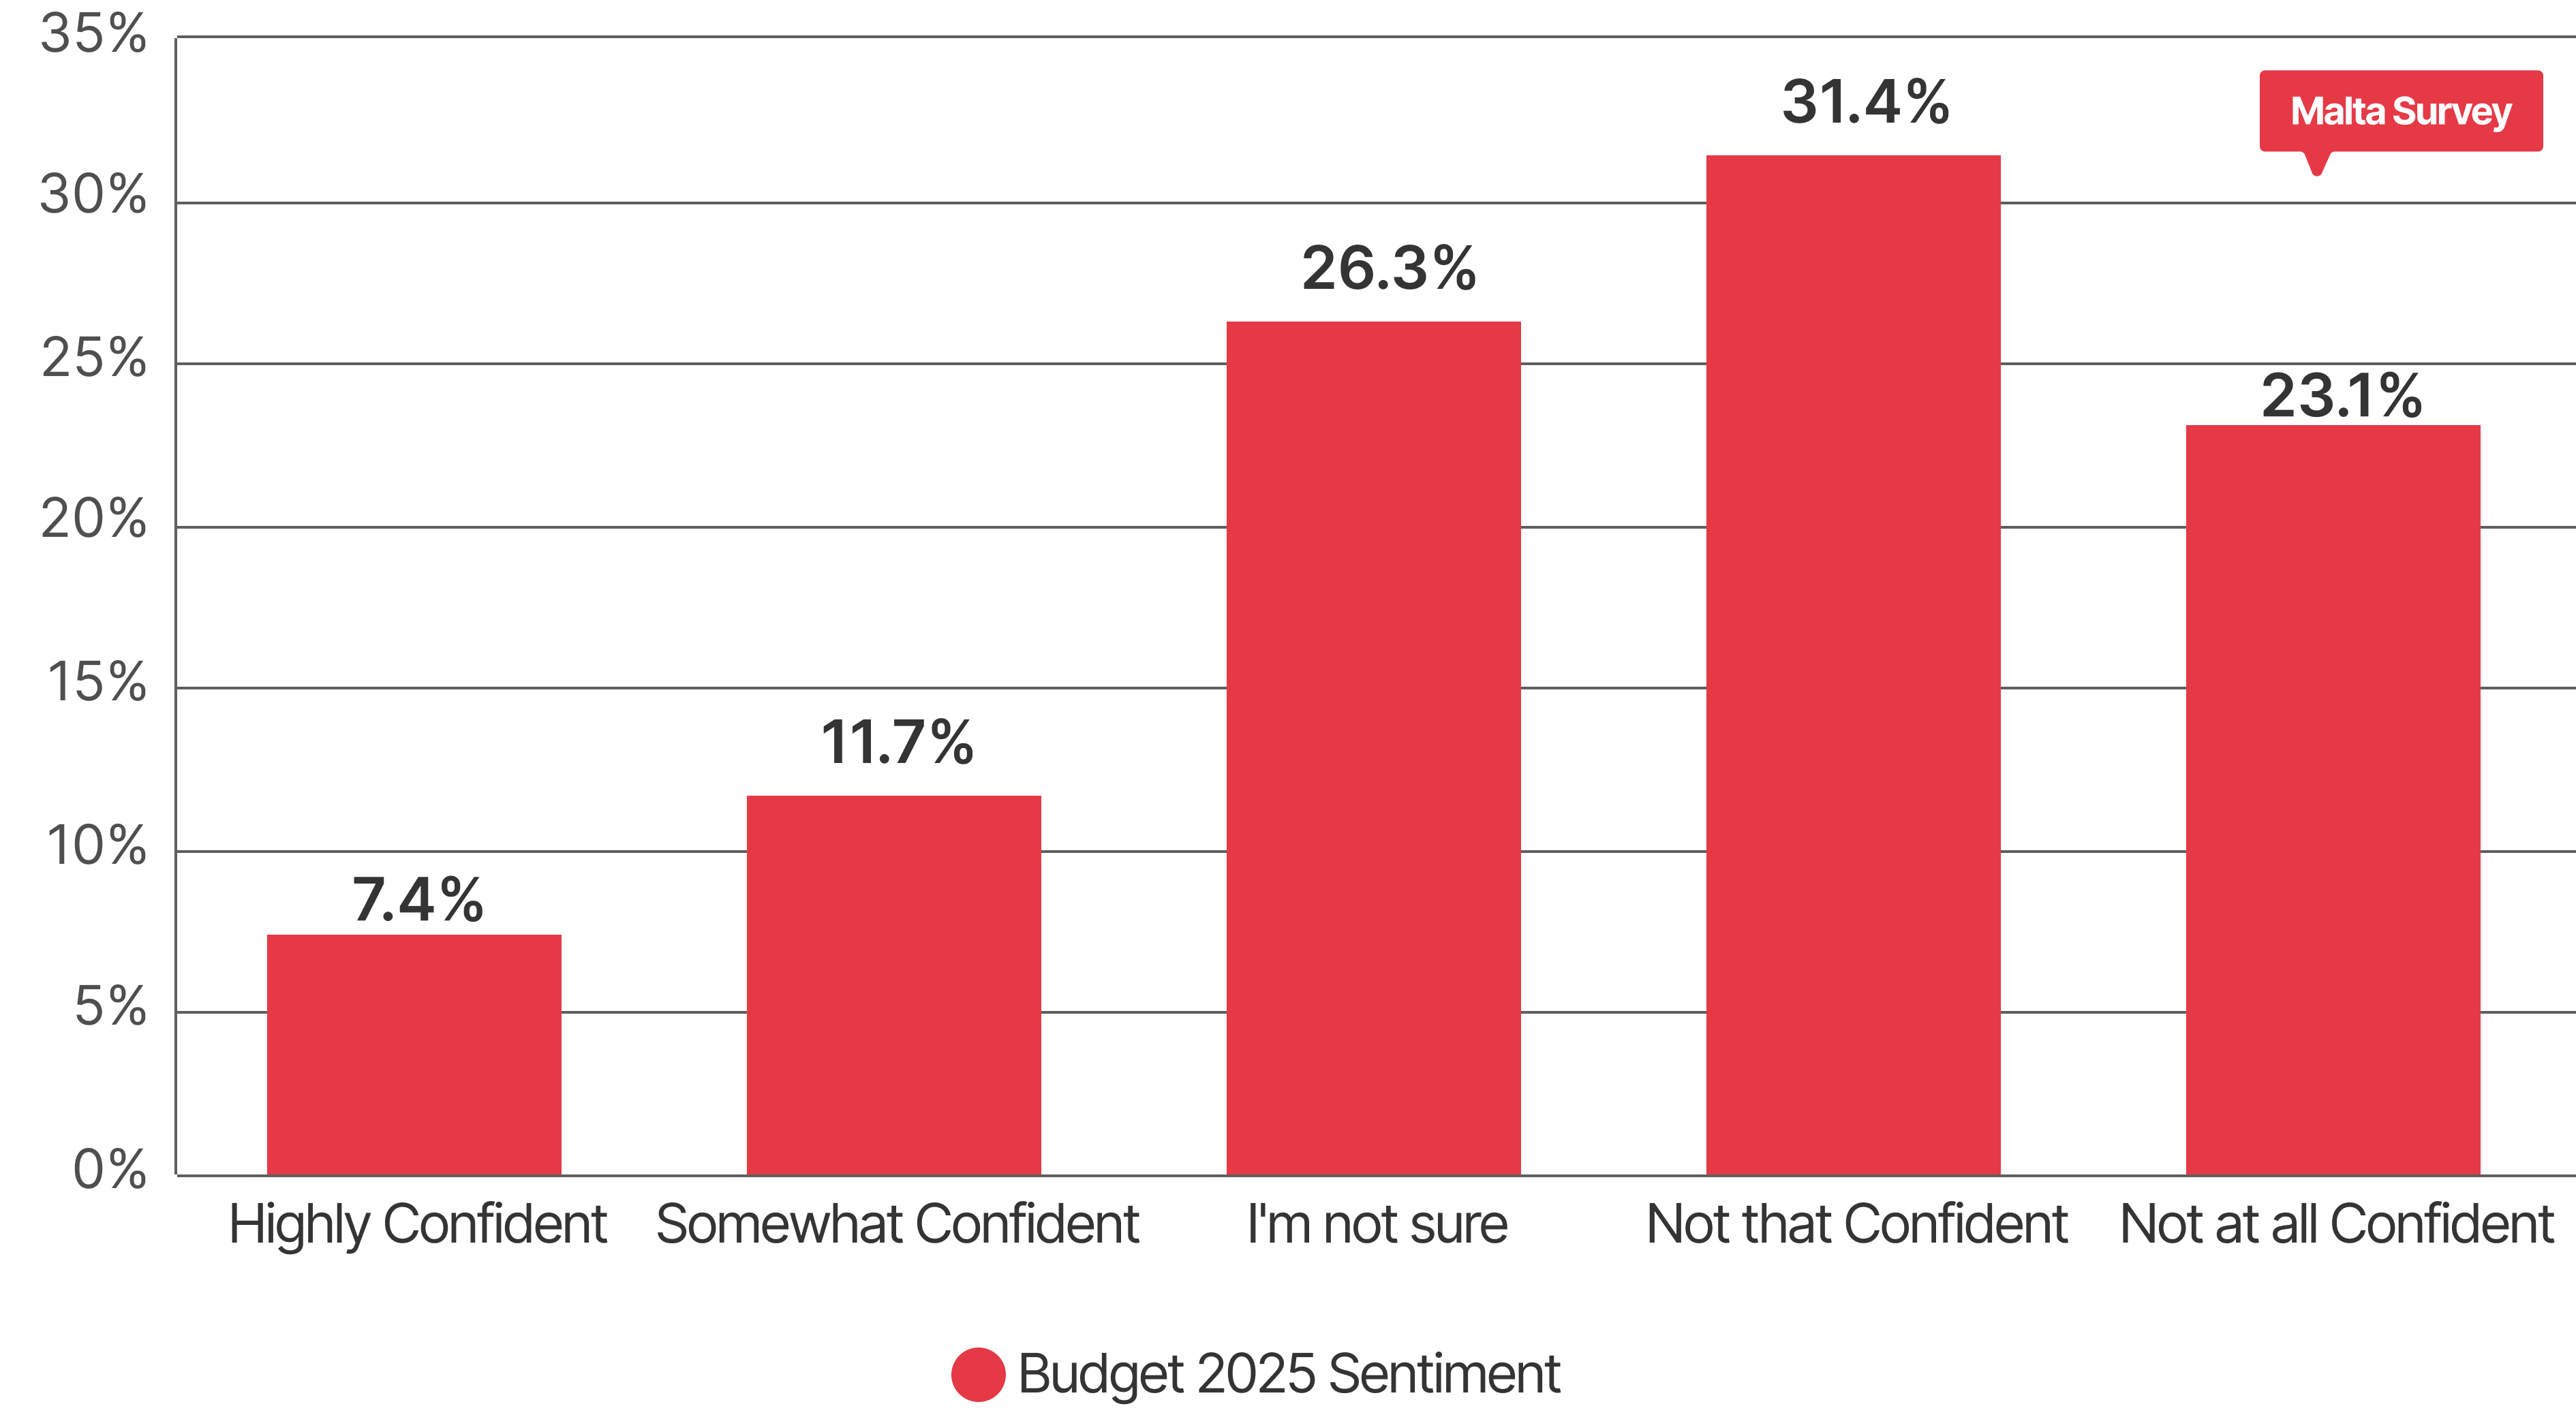
Whilst the most popular sentiment (Not that Confident with 31.4%) stayed consistent with last year’s perception, the results indicate a slight shift in the sentiment regarding expectations for the upcoming 2025 Budget compared to the 2024 Budget. Whilst the percentage of respondents expressing “Highly Confident” feelings increased from 5.6% for Budget 2024 to 7.4% for Budget 2025, those who are “Somewhat Confident” experienced a slight decrease, moving from 12.5% to 11.7%. Interestingly, uncertainty has risen, with the proportion of respondents who are “Not sure” climbing from 23.5% to 26.3%.
Meanwhile, a minor increase is seen among those who are “Not that Confident”, growing from 30% for Budget 2024 to 31.4% for Budget 2025. Notably, there is a more significant decrease in the “Not at all Confident” category, which dropped from 28.3% to 23.1%.
Overall, this suggests that while confidence levels have slightly improved, uncertainty remains high, and a considerable portion of respondents still lack confidence in the effectiveness of the upcoming budget.